
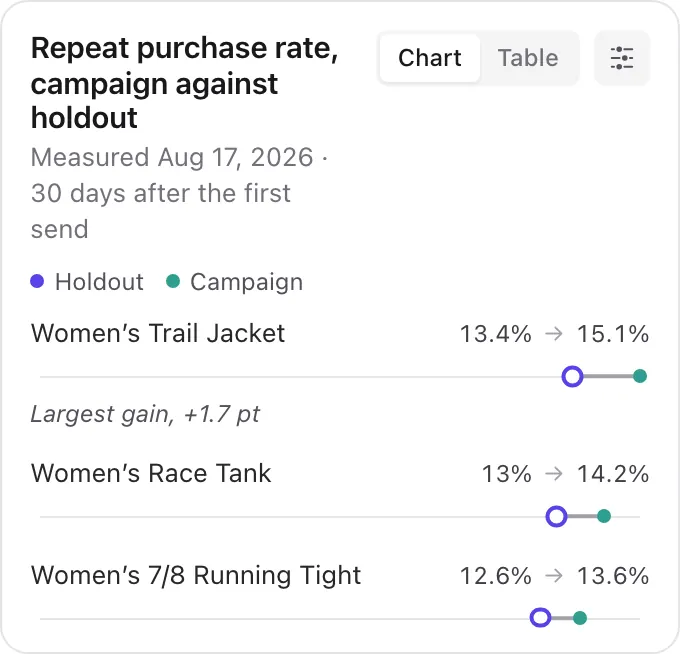
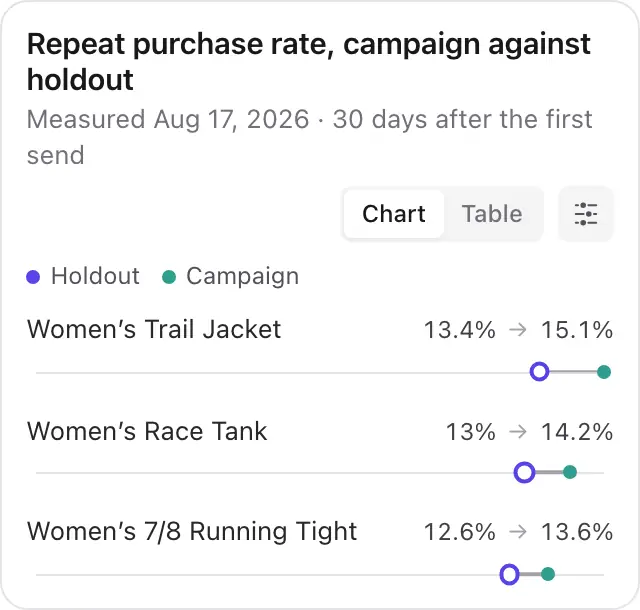
Compare repeat purchase rates between the campaign and control groups to assess results by product.

Analytics
Create custom metrics, analyze your audiences and measure campaign impact with a control group. Explore the data and calculation method behind each result.
Dan measures the lift
Compare repeat purchase rates between the campaign and control groups to assess results by product.


Measure
Create the metrics that matter to your business and compare campaign results with a control group, audience by audience.
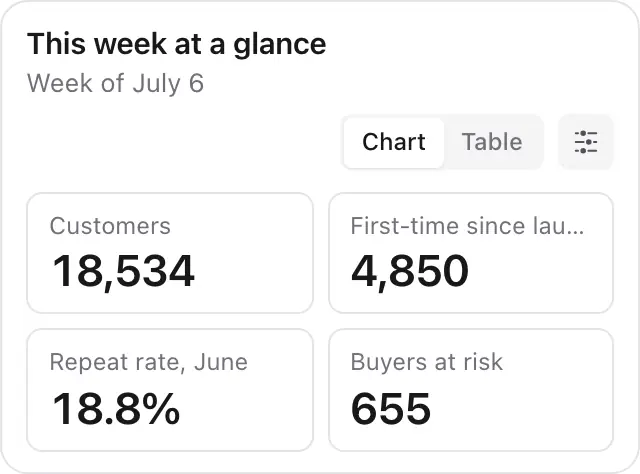
Customers
185,340
First-time since launch
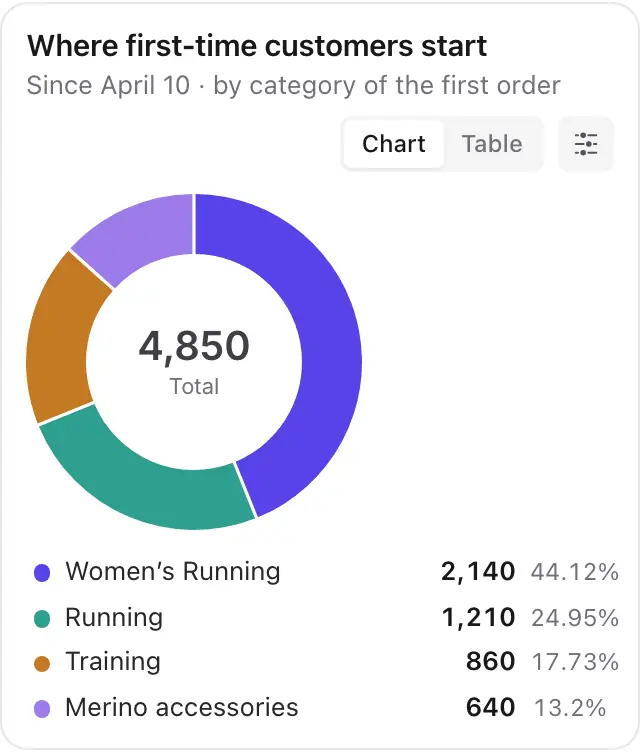
4,850
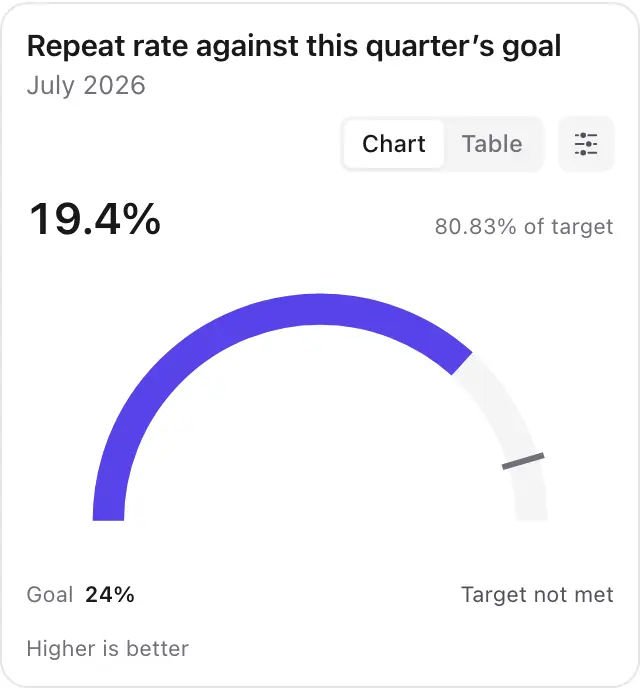
Repeat rate, July
19.4%
Buyers at risk
655

Repeat rate, June
18.8%

Audience
612
Held out
10%
Attribution window
30 days
Campaign
14.3%
Holdout
13.0%
Difference
+1.3 pt
Relative uplift
+10%

Measure revenue, orders, repeat purchases or other events in your data. Create custom metrics and track them all across your customer base or audience by audience.
Keep a randomly selected group out of the campaign. Compare results using the same metric and measurement period to estimate the campaign’s incremental impact.
Analysis
Explore trends, compare audiences and investigate changes in your results. Each chart includes the underlying data and calculation method.
What should I know this week?
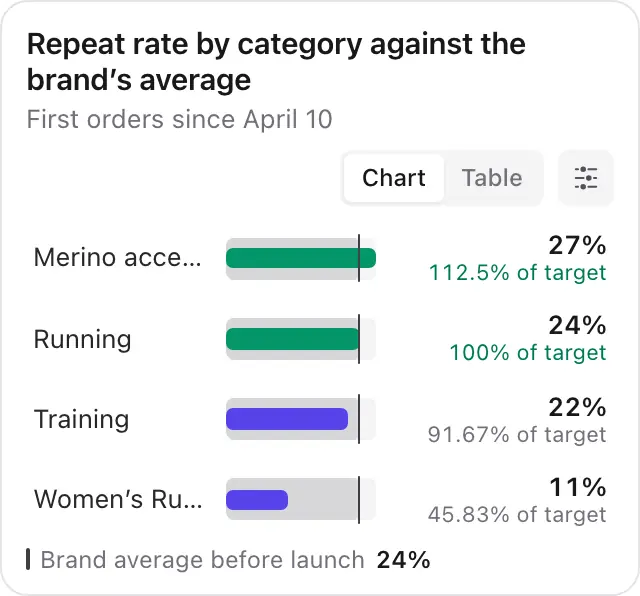
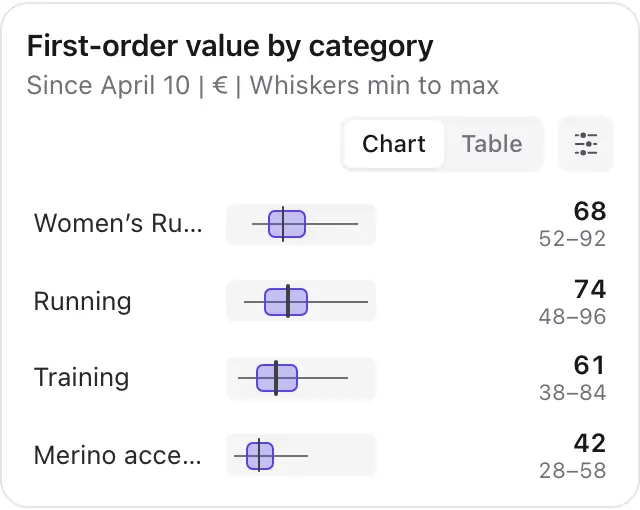
Which categories beat the brand’s average?
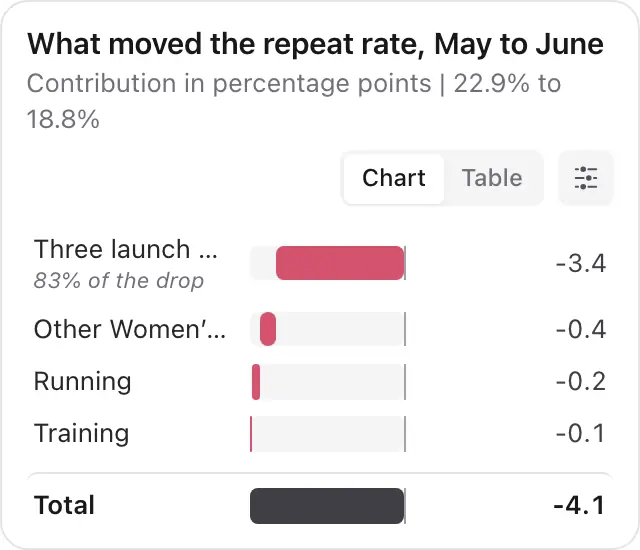
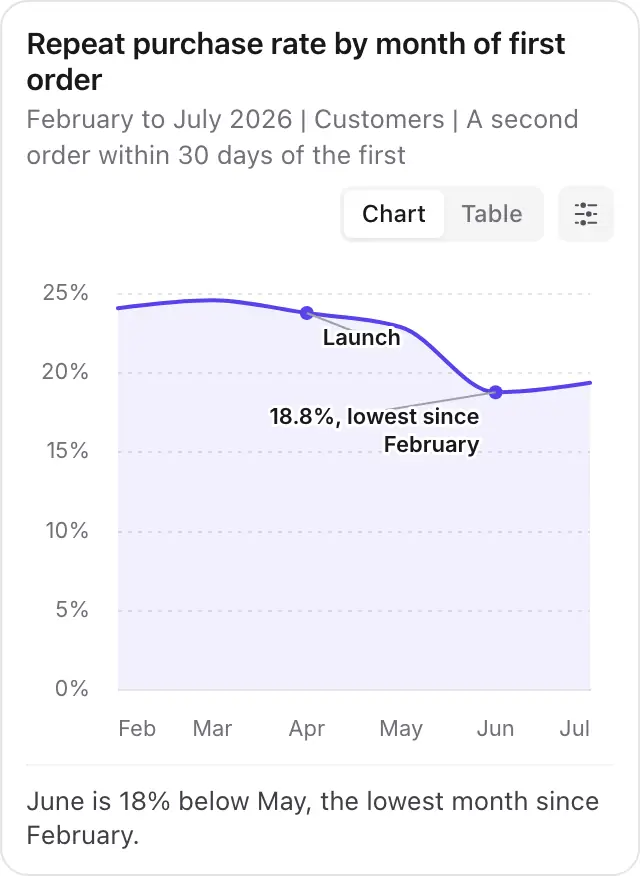
What moved the rate from May to June?
Did the campaign beat the holdout?
Why did repeat purchases drop in June?
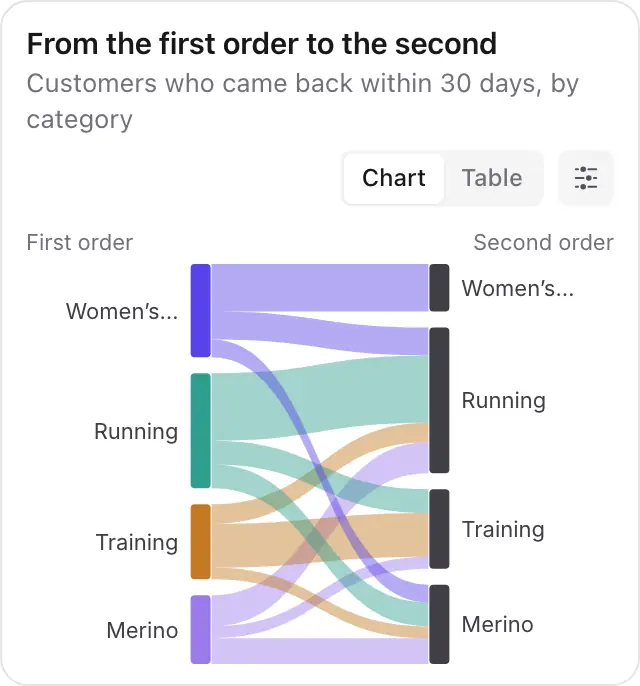
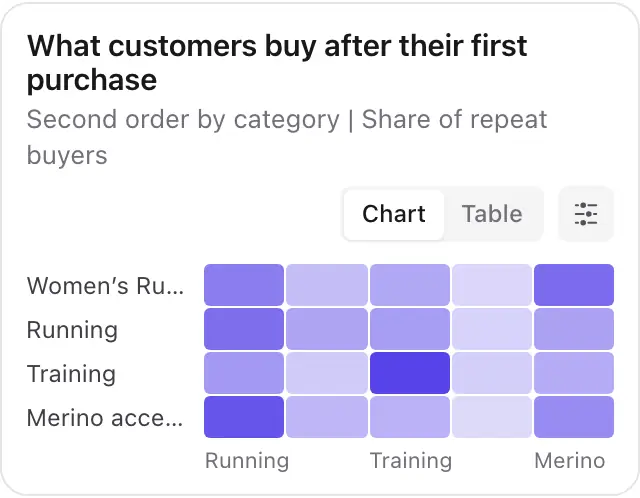
Which categories do customers choose for their second order?
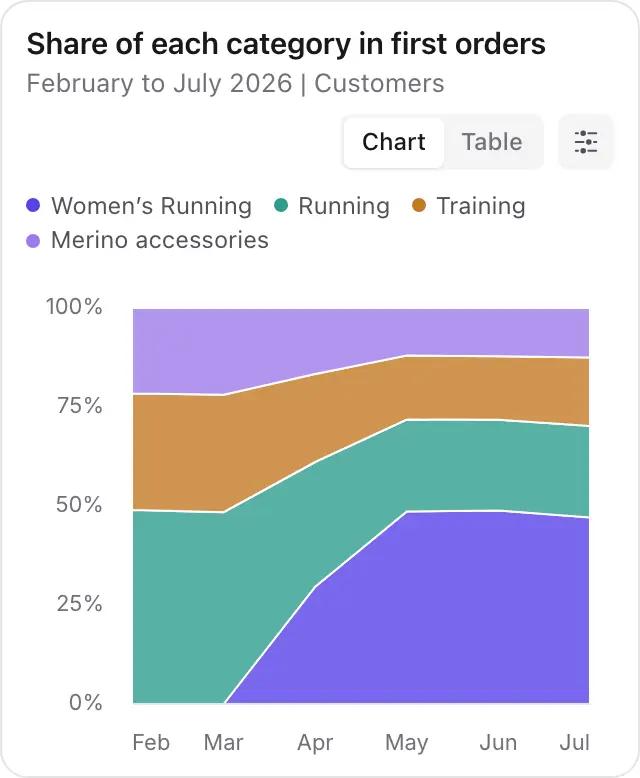
How did the mix change?
What do customers buy next?
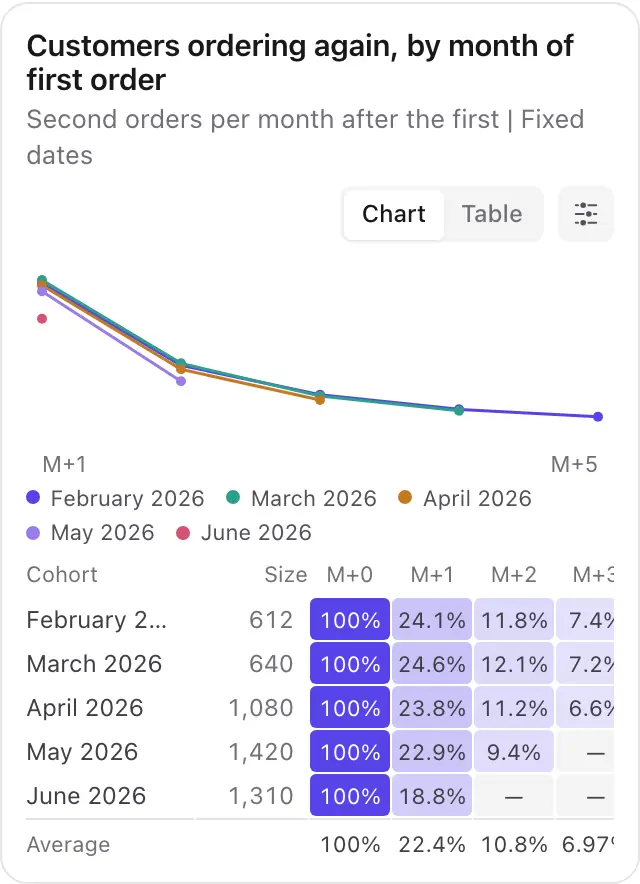
How does repeat purchasing vary by cohort?
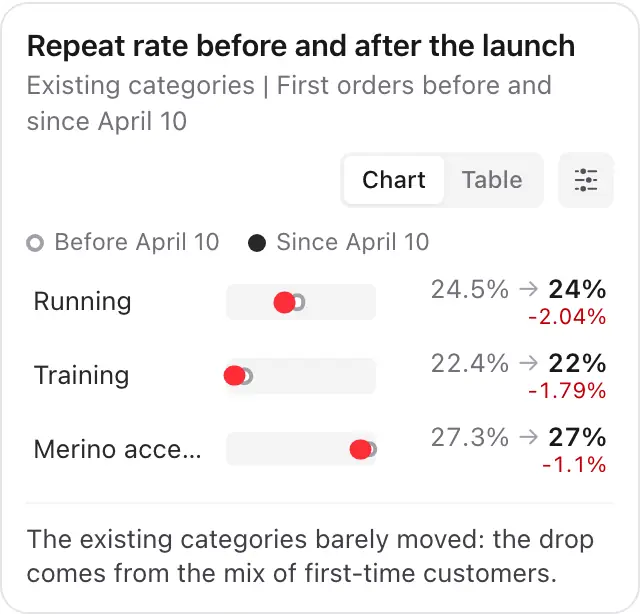
Did the other categories move?
Are we on track for the goal?
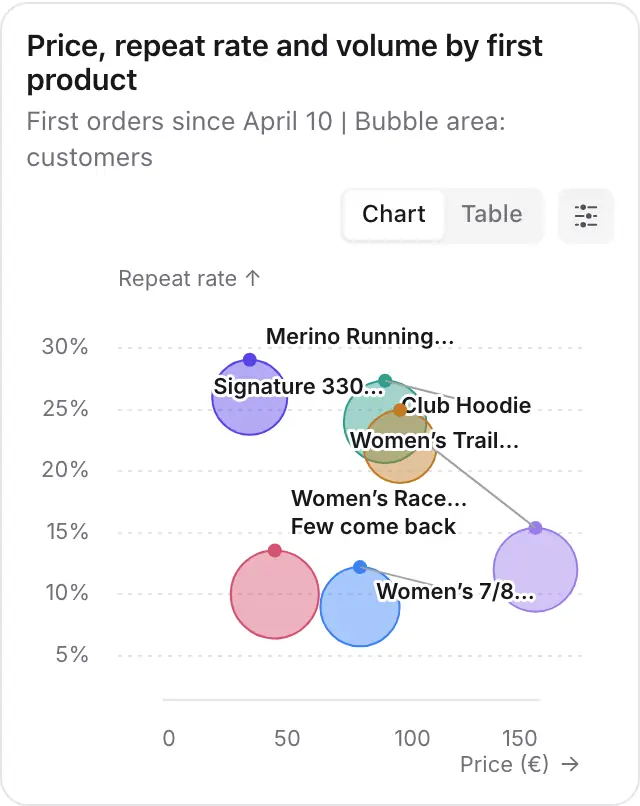
Price, repeat rate or volume?
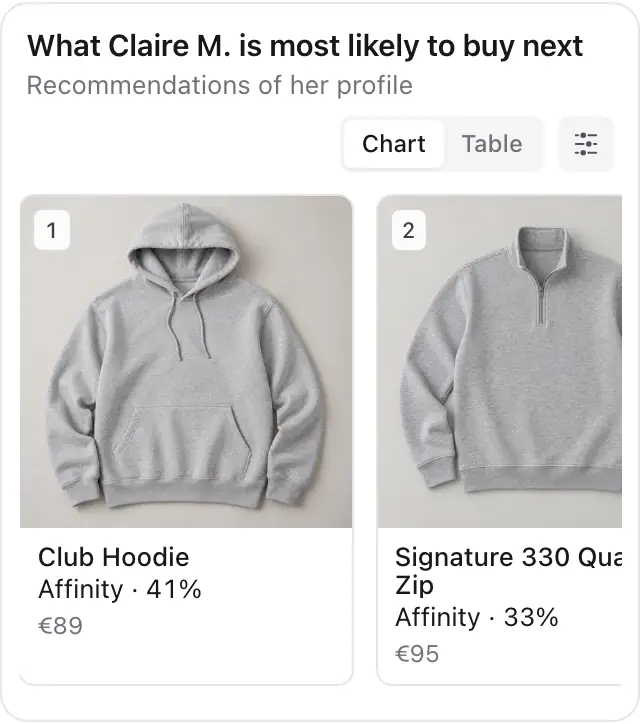
Which products does DinMo Intelligence recommend for Claire M.?
Where do first-time customers start?
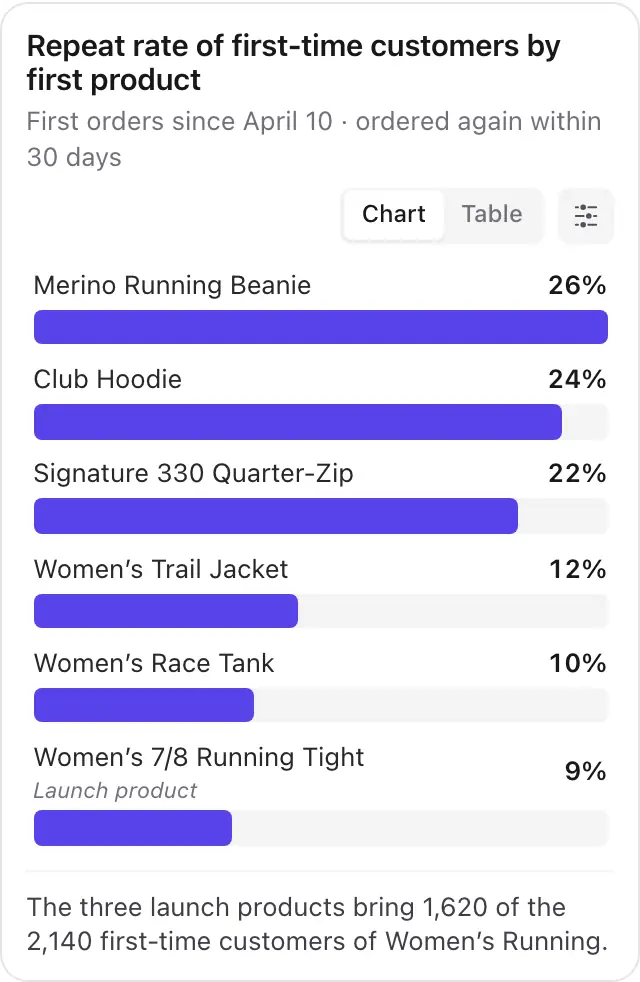
Which first purchases are followed by more repeat orders?
More new customers, but fewer repeat purchases?
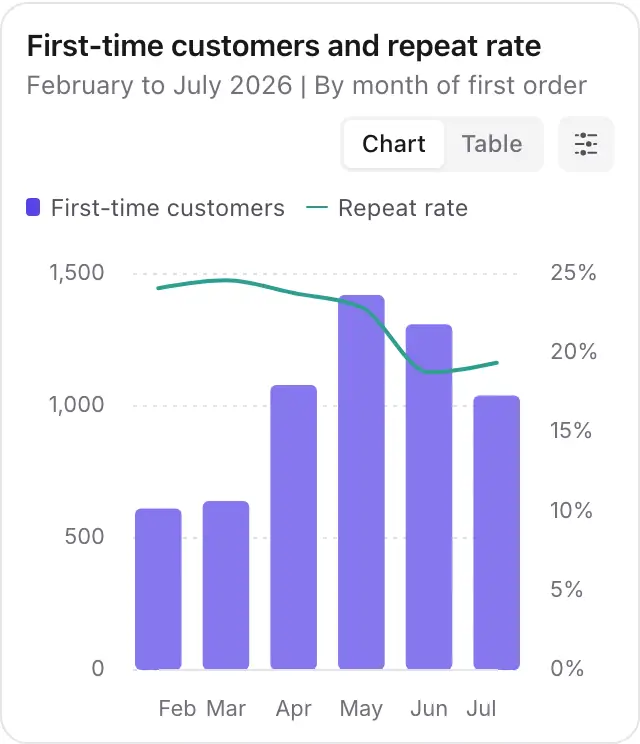
How do first-order values vary by category?
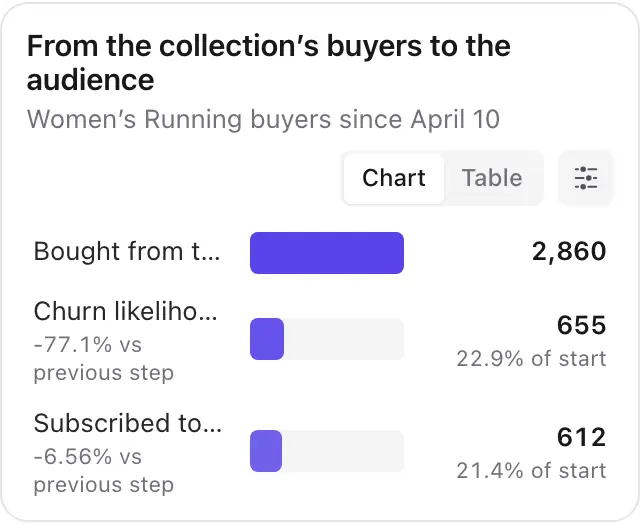
How many buyers can we still email?
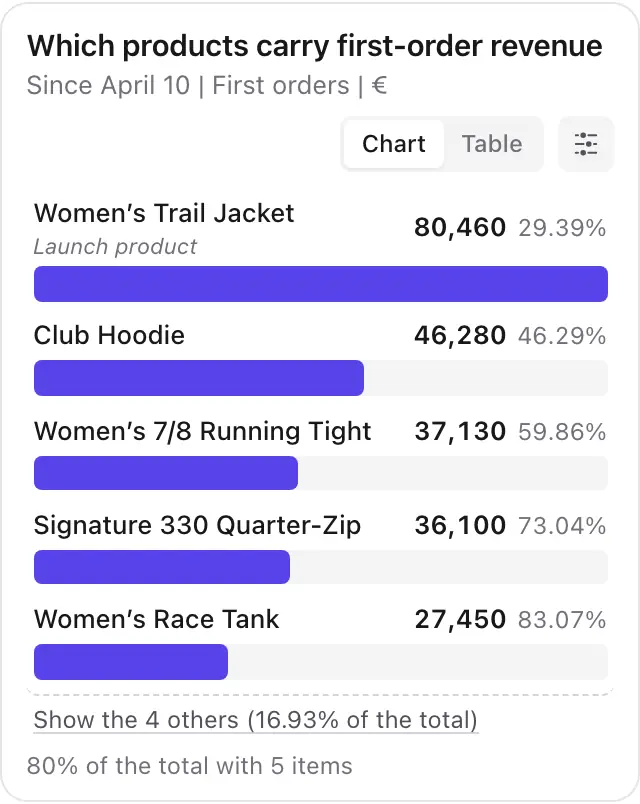
Which products carry the revenue?
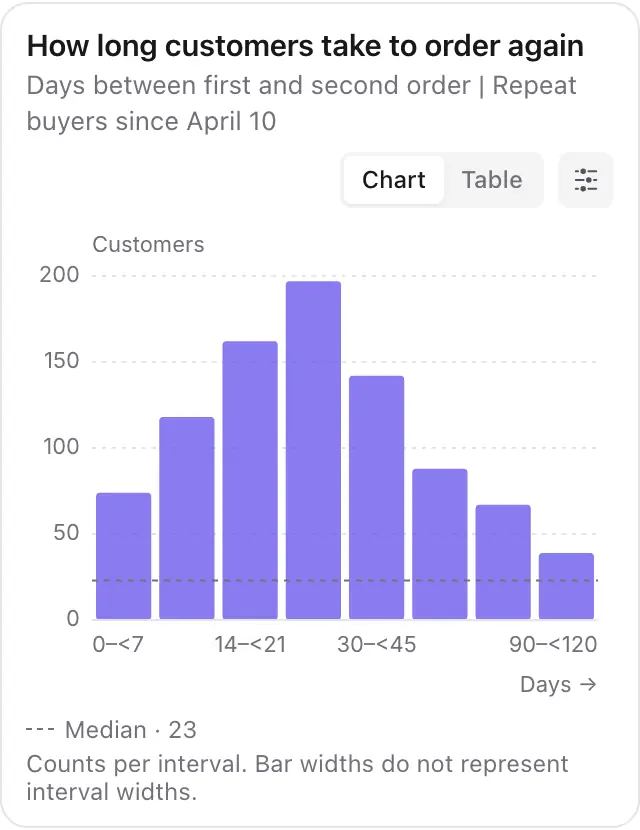
How long before a second order?
 Dan on Analytics
Ask why repeat purchases changed. Dan analyzes your data, shows the method and highlights differences between customer groups. It can then propose an audience with a control group to measure a follow-up action.
Why did repeat purchases drop in June?
Worked 41 s · 1 chart, 1 audience draft

A chart, its calculation method and an audience with a control group to test a follow-up action.
Calculations run on your data, with the metric definition, filters and measurement period available for review.
Review the analysis, adjust the proposed criteria and approve actions such as creating an audience.
Completed actions and approvals are recorded in the audit log, with who performed them and when.
Reports
Bring charts, notes and a summary from Dan together in one report. Keep metric definitions visible and share results according to your access rights.
Repeat purchases after the launch
Repeat rate, June
18.8%
Change against May
-18%
Drop from launch products
83%
Uplift against holdout
+1.3 pt · +10%
Dan summaryRefresh the summary
Repeat purchases dropped 18% in June. Three launch products explain 83% of the drop, and the existing categories barely moved. The win-back campaign brought 14.3% of the audience back, against 13.0% for the holdout.


01
Ask a question and review the result, underlying data and method.
02
Bring the charts and notes you need together in one report.
03
Return to your report to follow results and check when the data was refreshed.
Stay in control
Review the underlying data, metric definitions and calculation method without reading SQL.
Open the data table associated with each chart to explore the results in detail.
See the metric definition, filters and time period used in the calculation.
Calculations use your customer data and business definitions, with your existing access rights.
FAQ
Can I use Analytics without Dan?
Yes. Create and track metrics and compare campaign results with a control group directly in DinMo. Dan is optional: use it to ask questions in natural language and prepare analyses and proposed actions.
Where are the numbers calculated?
In your connected data warehouse. DinMo uses your customer data and business definitions, with the access rights of the person using it. Each analysis includes the data and calculation method used.
Which charts can I get?
Explore trends over time, audience comparisons, breakdowns, funnels, cohorts and flows. Dan can choose a suitable chart for your question. The underlying data table and method remain available for review.
How does a control group work?
A randomly selected part of the audience is excluded from the campaign. DinMo compares both groups using the same metric and measurement period, accounting for differences in group size where needed. This helps estimate the campaign’s incremental impact.
Do I need to replace my data warehouse?
No. DinMo connects to your existing warehouse, including BigQuery, Snowflake, Databricks, Redshift or PostgreSQL. You can also use a managed warehouse hosted by DinMo in the EU or the US.
Put your analysis into action
DinMo Analytics
Explore metrics, analyses and experiments with a demo tailored to your data and goals.

 Club Hoodie