

Agentic analytics: investigate customer data with AI agents
9min • Last updated on Oct 7, 2026


Alexandra Augusti
Chief of Staff
Your second-purchase rate is falling. The dashboard shows the change, but your CRM team still needs to establish which customers are affected, compare observation periods and explore possible explanations.
Agentic analytics lets AI agents take on part of that investigation. Starting with a marketing question, an agent can choose permitted tools, run several analyses and adjust its next steps in response to the results.
Within an agentic CDP, this work draws on customer data and business context. The useful outcome is analytics insight your team can check before deciding what to do.
Key takeaways
Agentic analytics supports investigations with several steps, beyond an individual answer or chart.
Natural language makes analysis more accessible; available data and business definitions determine its relevance.
A useful result identifies populations, calculations, observation periods and interpretation limits.
What is agentic analytics?
Agentic analytics is an approach to data analysis in which an AI agent helps organise and carry out an investigation. It may clarify the request, select authorised operations, inspect their results and decide which checks to perform next.
The scope differs between products. Some assist with exploration; others add proactive monitoring or actions. Tableau describes agentic analytics as support from AI agents across several stages of analytical work, with people remaining in control.
For marketing teams, the practical question is whether an agent can investigate declining repeat purchases without someone manually preparing every filter, extract and comparison.
Agentic describes how the work is performed. It does not mean the system knows every dataset, can automatically establish causes or has permission to launch a campaign.
Dashboards, conversational analytics and agentic analytics
Traditional and agentic analytics can work together:
Approach | Main purpose | Example |
|---|---|---|
Dashboard | Monitor defined metrics and dimensions | Track the second-purchase rate each month |
Natural-language analytics | Query data through a question expressed in words | Ask for the rate by first-purchase category |
Agentic analytics | Carry out several analyses adapted to the question and findings | Check the decline, compare populations and examine limitations |
A chat interface alone does not demonstrate agentic analytics. Anthropic distinguishes workflows from agents by whether operations follow a predefined path or the system dynamically directs its use of tools.
If an existing report answers the question, keep using it. Agentic analytics becomes relevant when several checks are needed and the next step depends on what the previous one reveals.
The expression conversational analytics also needs care. It can refer to querying data conversationally, or to analysing customer conversations. Here, natural language is the interface for exploring customer data; call transcripts and sentiment analysis are a separate subject.

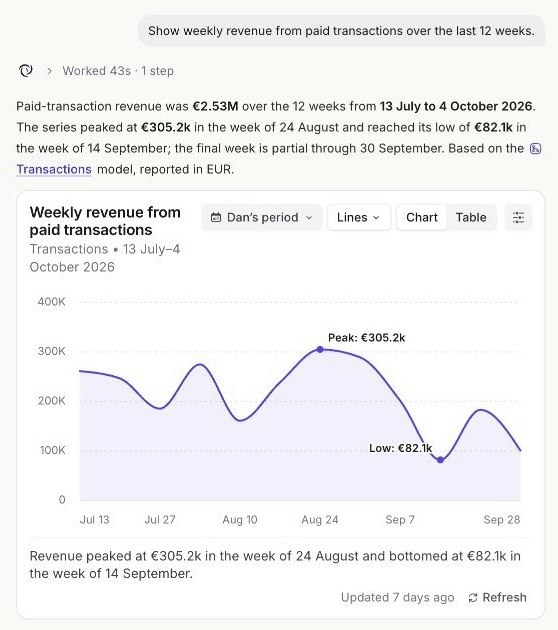
From question to revenue chart — demo data.
What makes an agentic analytics system reliable?
An agentic analytics system brings together a language model, permitted tools and business context. The model interprets the request and helps organise the work. Tools retrieve or calculate data. Shared definitions allow analytics agents to interpret the results in the organisation's terms.
These responsibilities should be explicit. Generative AI can produce a plausible answer without calculating the requested value. A reliable analytics agent therefore needs evidence from its tools, rather than relying on a fluent explanation.
A semantic layer that connects data to business meaning
A semantic layer records what data means: relationships between models, metric definitions, calculation rules and agreed business vocabulary. It gives agents and human users a common reference.
In our retail example, that includes the eligible first order, the customer identifier and the observation window. Those definitions should remain consistent across the query, chart and report. Otherwise two teams can receive different answers to what appears to be the same business question.
Governed data access also matters. Analytics agents should only see sources and fields available to the user. A semantic model helps interpret information; it does not replace access controls or data-quality checks.
Tools, reasoning and a bounded feedback loop
Agentic analytics workflows can follow a bounded loop: select a task, call an authorised tool, inspect the result, then continue or stop. Agents use feedback from their tools to decide whether another comparison is needed. The organisation should define the permitted actions and the evidence required before progressing.
For example, analytics agents may query customer data and prepare a chart while remaining unable to activate an audience. Tool interfaces should describe inputs, outputs and limitations. MCP can connect agents to compatible tools, but does not establish whether a calculation or recommendation is correct.
The infrastructure must support this work predictably. Monitor query time, model usage and costs, especially when analytics agents make several calls to cloud systems. A sequence of autonomous operations can be slower or more expensive than an existing dashboard. Evaluate performance across the complete workflow, including human review.

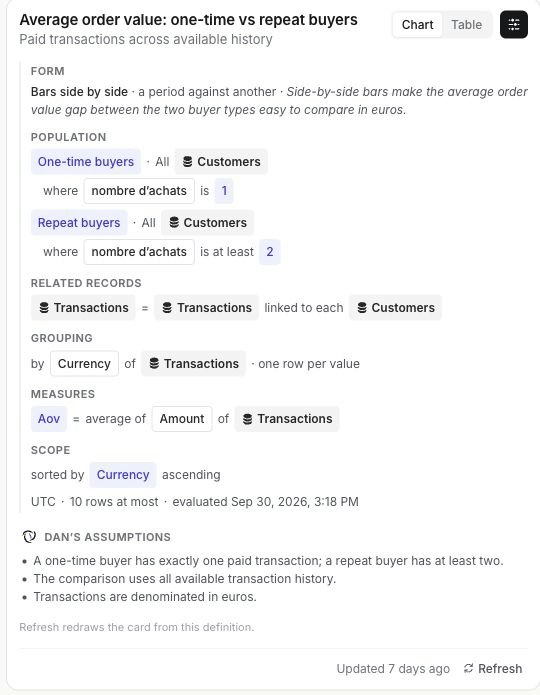
Inspect populations, measures and assumptions — demo data.
What benefits can agentic analytics bring to teams?
Agentic analytics can help organisations reduce repetitive work between a business question and an initial diagnosis. Agents can explore relevant dimensions, prepare visualisations and present insights for a human reviewer.
Marketing teams gain a more accessible way to investigate customer behaviour. Data teams retain responsibility for models, definitions and governance. The useful benefit is not simply more answers: it is a shorter path to a reliable answer that other users can inspect.
Some agentic systems add proactive monitoring. Ask which metrics they monitor, how often they refresh the data and what happens when a threshold is crossed. An alert is a starting point for investigation, rather than proof of a commercial problem.
Compare this approach with traditional analytics on a recurring question. Measure accuracy, corrections, time to approval and whether the resulting insights change the team's understanding. These practices make the business case assessable without assuming an improvement in revenue.
How do AI agents investigate customer data?
1. Turn the question into explicit criteria
“Why are customers buying again less often?” leaves several choices open. Does the team mean all customers or first-time buyers? Which periods should be compared? How long should each customer have to place another order?
A more useful brief would be:
Compare the 60-day second-purchase rate for customers whose first eligible order was in January and February. Apply the approved order definition, show population counts and check whether both cohorts have the same observation window.
The analytics agent should confirm those criteria or ask for clarification. A useful answer starts with what will be measured, before suggesting an explanation.
The team also needs to agree the stopping point. The first task may be a documented comparison, rather than a recommendation to change targeting. This keeps the investigation assessable and gives the reviewer a clear expected output.
2. Use shared data and business definitions
The analytics agent needs reliable relationships between customers, orders and products. Its data model should identify keys, timestamps and eligibility rules, including cancelled orders, returns, test purchases and transactions in physical shops.
Shared context also prevents vocabulary errors. An “active customer” might mean someone with a recent purchase, a current subscription or regular product usage. These definitions serve different purposes.
3. Adapt the investigation to the first findings
The analytics agent can begin by recalculating the metric, then examining how it varies across relevant dimensions.
If the decline is concentrated in a particular first-purchase category, the next useful comparison may be within that category. If a data source is missing for part of the period, the immediate priority becomes data quality.
Set boundaries for this work: accessible sources, permitted operations and the expected number of checks. Repeatedly slicing data until a striking difference appears is unlikely to produce a sound diagnosis.
Analytics agents should keep unresolved questions visible. An unavailable acquisition source should remain unavailable, rather than being inferred from another field without the team's agreement.

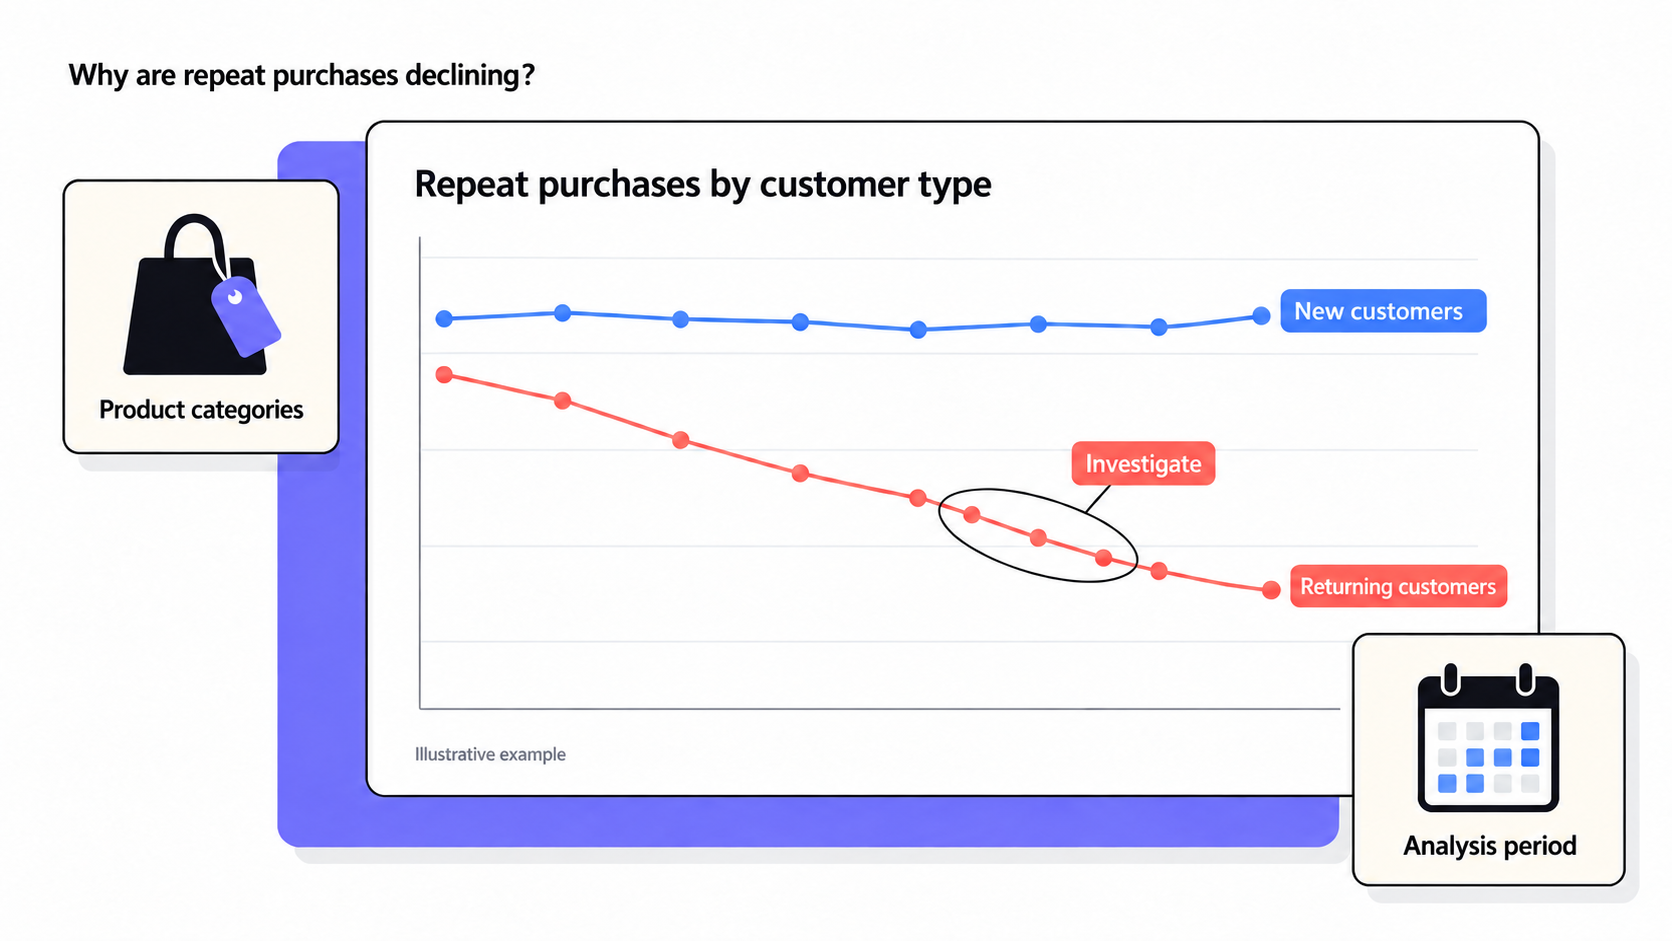
Illustrative example: comparing customer groups helps identify differences worth investigating.
4. Return evidence the team can inspect
The analytics answer should bring together:
the question and definitions used;
sources, filters and refresh dates;
population counts and main calculations;
observations supported by the results;
hypotheses and missing information.
A marketer should be able to read the analytics summary while the data team can inspect more detailed operations where necessary. What matters is a record of operations and results, without requiring access to the model's private internal reasoning.
The record should also distinguish the initial request from later changes. If a reviewer excludes returned orders, that change belongs alongside the resulting metric so the next person understands why the number differs.
Example: investigating a lower second-purchase rate
Consider a fictional retail example, unrelated to the performance of a DinMo customer. Both cohorts have been observed for 60 days after the first order.
Cohort | Eligible first-time buyers | Customers making a second purchase within 60 days | Rate |
|---|---|---|---|
January | 1,000 | 220 | 22% |
February | 1,000 | 180 | 18% |
The difference is 4 percentage points. These figures describe an observed decline; they do not establish its explanation.
Check that the comparison is consistent
Before exploring behaviour, check the foundations. Are the data sources complete? Has the order definition changed? Does every customer in both cohorts have a full 60-day observation period?
Compare customers at the same stage of their relationship with the brand. A recent cohort may appear to perform worse simply because its members have had less time to purchase again.
Also examine customer identifiers. Someone represented by two IDs can appear to be two first-time buyers. The diagnosis should disclose that limitation if it affects the measurement.
Document how late-arriving orders are handled. Re-running the same analysis after missing transactions arrive can change the result without any change in customer behaviour.
Identify the populations behind the change
Next, compare first-purchase categories, acquisition sources or countries where those fields are available.
The aim is to locate the difference alongside the relevant population counts. A group of ten customers calls for a different interpretation from a population of several thousand.
Check the cohort mix too. The overall rate can fall if February contains more customers in a category with a historically lower repeat-purchase rate, even when rates within each category remain stable.
This is why an aggregate chart should be accompanied by the breakdown needed to interpret it. More detail is useful when it tests a specific explanation, rather than merely adding more views.
Separate observations from hypotheses
Suppose the difference is concentrated among buyers in a seasonal category. A useful response might state:
Observation: the category accounts for a larger share of February's new customers.
Hypothesis: its replenishment pattern may contribute to the lower overall rate.
Next check: compare an appropriate seasonal period and inspect rates within each category.
Analytics agents should not conclude that a discount will solve the problem. The immediate output helps the team identify what it understands, what remains uncertain and which data to examine next.
Which marketing questions are suitable?
Understand differences between populations
CRM teams can compare repeat purchases, engagement or observed value across defined customer groups. Analytics agents can help prepare those comparisons and document their limitations.
A request to “compare loyal customers” needs an agreed definition of loyalty. Business language still needs explicit criteria.
Explore purchases across categories
A retailer might investigate which categories customers buy after their first product, accounting for population size and the observation period.
These analytics insights reveal associations worth exploring. It does not demonstrate that a recommendation would generate additional purchases, or that the products are currently available and profitable.
Investigate an anomaly before responding
A sudden movement in a metric may reflect customer behaviour or an incomplete data source. Ask the analytics agent to check record volumes and refresh dates before proposing a commercial interpretation.
That check can prevent the team from preparing an audience around a collection problem.
Examine engagement in a subscription service
A subscription team might ask analytics agents to investigate falling product usage. Start with the definition of an active user and check whether the systems supplying usage data have changed. Compare customer groups at the same subscription stage.
Agents can query the relevant data, inspect which activities declined and return analytics insights for review. Their answer should identify missing data and distinguish a change in measurement from a change in behaviour. Human reviewers then decide which further checks are needed.
This is a useful agentic analytics task when the next comparison depends on the first findings. It can support decisions about what to investigate, but does not establish which marketing actions will improve retention. That requires separate evidence.

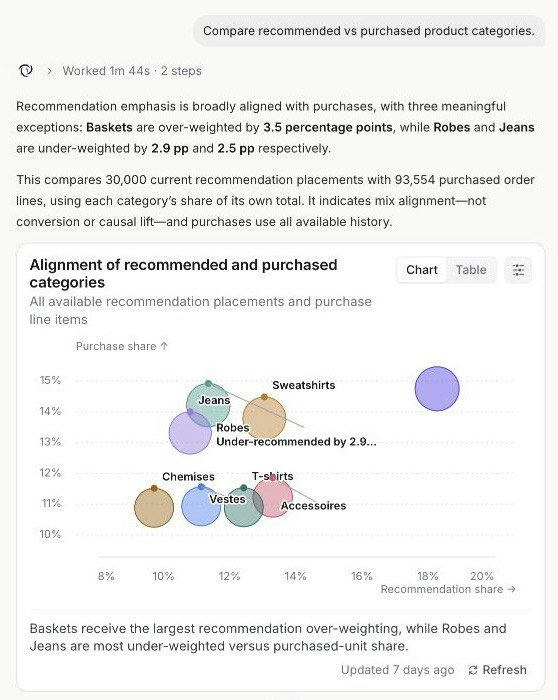
Compare recommended and purchased categories — demo data.
How should you validate agentic analytics?
Inspect calculations and populations
Validate the investigation against a reference calculation, not the confidence of an answer. Users should check the numerator, denominator, exclusions and population counts. Gross revenue and revenue net of returns answer different questions. When agents join orders and products, check that multi-item orders are not counted twice.
Agree what success means before testing the workflow: the correct value, the correct customers and the context needed to interpret both. An attractive chart is insufficient if the population is wrong. Data teams should be able to inspect the operations agents used and reproduce the result with a conventional report.
Check data quality and consistency
The system needs complete data sources and comparable observation periods. Test an ambiguous request, a missing field and a population too small for meaningful analysis. Analytics agents should disclose limitations or stop; autonomous reasoning does not authorise them to invent missing data.
Rephrase the question. Agreed criteria and calculated results should remain consistent when data is unchanged. If agents choose different queries, inspect the definitions and query logic before accepting conflicting answers. Preserve corrections so users can distinguish a semantic definition problem from an error in the operations.
For recurring analytics workflows, define controls for record volumes, refresh dates and failed queries. Monitoring should tell teams when the data infrastructure is incomplete, rather than treating every movement as a change in customer performance.
Interpret findings with care
Correlation does not establish causation. Customers who received an email may already differ from those who did not because of targeting rules. Measuring the email’s effect requires an appropriate test.
Keep human review of conclusions. Distinguish observations from assumptions and recommendations, and retain the sources, filters and calculations needed to check the findings. Set reading permissions separately from activation permissions.
With DinMo, move from a business question to measurable action
Understanding a fall in repeat purchases is a starting point. Choosing a useful action and tracking its results takes the investigation further. DinMo connects your business context, data exploration, recommendations and measurement.
Ground the analysis in your business context
Your data becomes more meaningful when it reflects how your business works. DinMo lets you define a context layer covering data models, relationships, business terminology and shared definitions. This context guides the analysis towards answers relevant to your organisation.
Explore and follow up through chat
Ask a question, compare customer groups or investigate a finding through conversation. Graphs make differences visible, while reports built from those graphs help your team share insights and track the indicators that matter.

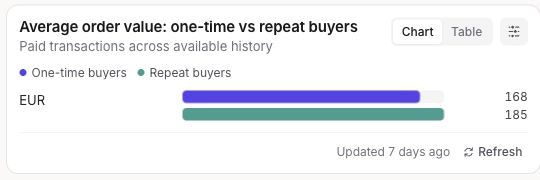
Compare two buyer populations — demo data.
Turn findings into proposed actions
An investigation can lead to concrete recommendations for marketing actions. DinMo suggests next steps based on the findings. Your team stays in control and approves the actions to implement.
Follow the results and inform the next decision
Once approved actions have been implemented, DinMo returns to measure the results after an observation period. Your team can examine changes in the indicators, assess the outcomes and refine its next decisions.
With DinMo, each business question can start a cycle of improvement: explore, decide, act and measure.
Start with one analytics question your team can verify
Choose a question your team already handles, with accessible data and a reference result. This customer analytics question is suitable when its definitions are established.
Agree a limited scope, assign an owner for the metric and organise a joint marketing and data review. Assess the total time to approval, corrections required and whether someone else can revisit the analysis.
That gives you a concrete way to judge agentic analytics: a better-explored question, checked calculations and a usable diagnosis. From that foundation, your team can discuss appropriate marketing actions with DinMo.
Agentic analytics FAQ
How autonomous should analytics agents be?
How autonomous should analytics agents be?
Autonomy should apply to a defined task and explicit permissions. An agentic analytics framework should identify which operations agents can perform, which data they can access and which actions need human approval. Analytics agents may prepare comparisons; changing semantic definitions or executing an activation requires separate controls. Teams remain responsible for interpreting insights and accepting recommendations before a business decision. An autonomous agent should ask for clarification when the data or permitted actions do not support a reliable answer.
What should you check when data sources change?
What should you check when data sources change?
A renamed field, late records or changed business logic can alter analytics without a change in customer behaviour. Retain a reference dataset and expected calculations. After changes to models or permissions, test the analytics workflow and compare populations and observation periods. Monitoring these controls helps organisations detect data pipeline problems before agents refresh graphs, reports or recommendations. Analytics agents should flag affected data sources so users can judge whether an earlier answer remains reliable.
How should you evaluate an agentic analytics platform?
How should you evaluate an agentic analytics platform?
Evaluate the platform on recurring business questions with known results. Ask how agents perform calculations, access data models and expose operations for human inspection. Test whether another user can retrieve context, charts and calculations, correct a definition and assess limitations. Compare the complete analytics workflow with traditional analytics, including time to validation, before organisations implement wider automation. Include questions with known answers and a case where agents should stop instead of recommending a decision.