From Business Intelligence to Marketing Activation
6min • Last updated on Dec 8, 2025

Olivier Renard
Content & SEO Manager
‘Data is the new oil.’ The phrase coined by Clive Humby in 2006 has since become iconic.
We have never produced as much digital data as we do today. Its volume is 11 times higher this year than a decade ago, and 90 times more than fifteen years ago (Statista).
A valuable resource, but only if properly harnessed. It is estimated that two-thirds of employees use Business Intelligence tools, yet few manage to derive real value from them.
Key Takeaways:
Business Intelligence (BI) helps companies better understand their data to guide decision-making.
It plays a central role in building a data-driven culture. By aligning teams around shared indicators, it fosters an objective, results-oriented approach.
BI tools are a core component of the modern data stack. They offer native connectors with cloud data warehouses such as Snowflake or Google BigQuery.
A composable CDP complements BI, enabling marketing or sales actions based on the insights generated upstream.
👉 How can you leverage Business Intelligence to make the most of your data? Discover the main tools, key use cases and synergies with a composable CDP. 🎯
What is Business Intelligence?
Business Intelligence (BI) refers to the tools and methods used to exploit a company’s data to steer its activities and support decision-making.
Its objective is to transform raw data into useful, actionable insights.
BI is based on three core principles:
Collecting data from various sources (CRM, ERP, website, etc.),
Analysing this data to identify trends or anomalies,
Presenting the results in the form of reports or visual dashboards.
It allows teams to share a common data-driven perspective, enabling decisions to be made on measurable indicators rather than intuition.
💡 Don’t confuse Business Intelligence with data visualisation, which is one of its components. It also goes beyond analytics, covering the entire data transformation cycle, from ingestion to decision support.
How does it work and which tools are involved?
Business Intelligence relies on a simple architecture, enabling users to access reliable, up-to-date data. Each stage of the process aims to make data more understandable and actionable.
Phase | Description | Main tools |
|---|---|---|
Data collection | Data is extracted from various sources (CRM, ERP, website, etc.) using ETL or ELT processes. | Fivetran, Airbyte, Talend |
Storage in a data warehouse | Data is centralised in a warehouse to be structured and accessible. | Google BigQuery, Snowflake, Amazon Redshift, Databricks |
Analysis and reporting via BI tools | BI tools connect to the warehouse to build reports and interactive dashboards. | Power BI, Tableau, Qlik, Metabase, Looker Studio |
Business Intelligence process
Online Analytical Processing (OLAP) is a concept intrinsically linked to Business Intelligence. Historically, it relied on precomputed cubes designed to facilitate multidimensional analysis.
However, OLAP cubes have the drawback of being rigid and difficult to maintain. Modern BI tools now leverage the computing power of cloud data warehouses to query data in real time.
These modern warehouses provide security, scalability, and performance. They serve as the foundation for delivering clear insights to business teams without requiring complex queries.
What is BI used for in business?
Business Intelligence helps analyse performance, spot opportunities and support data-driven decisions. Its applications vary by department, but the objective remains the same: to ‘make data speak’ and turn it into an operational asset.
Key use cases:
Marketing: campaign ROI tracking, conversion rate analysis, measuring Customer Lifetime Value (CLV).
Sales: performance by product or channel, identifying new opportunities, monitoring the sales cycle.
Finance and Management: budget forecasting, cost/margin analysis by segment, automated financial dashboards.
Product: trend identification, performance by product range, adapting the offer to local demand.
Leadership: synthetic view of key KPIs, business activity monitoring, strategic planning.
Each team accesses metrics tailored to their needs via an interactive, visual interface.
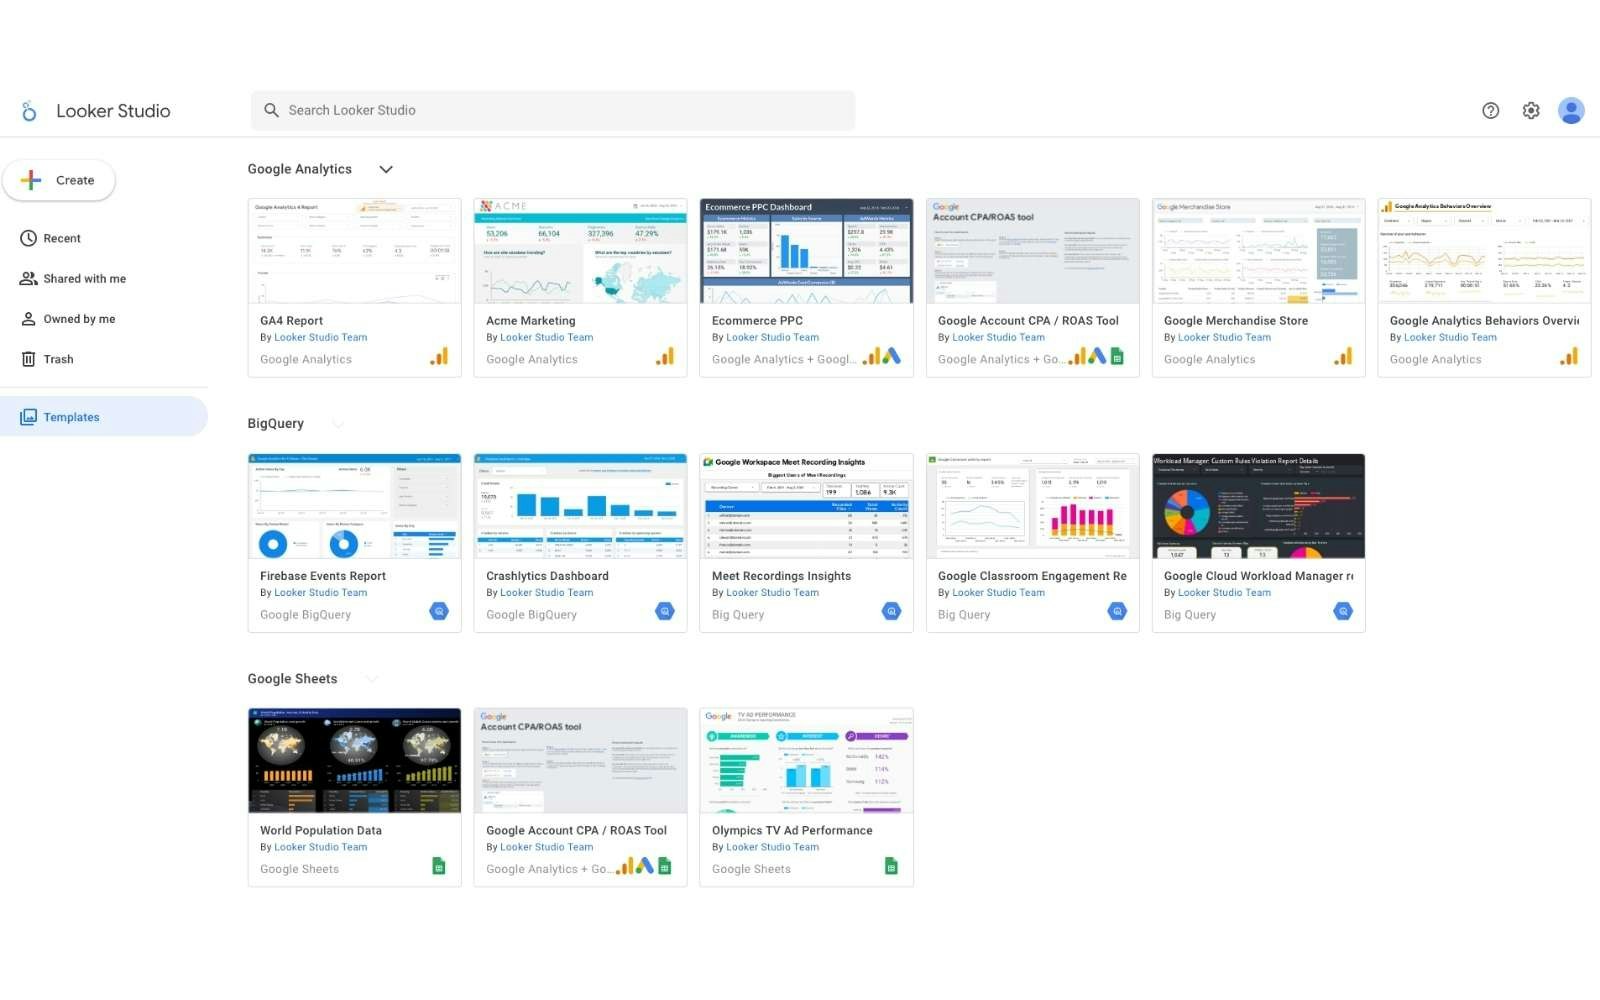
Looker Studio templates
From analysis to activation
BI tools such as Looker or Power BI provide access to data for analysis — but what about activation?
Marketing teams can see high-value segments, potential churn and product affinities. The next step is turning these insights into campaigns.
In its modern form, Business Intelligence gives operational teams far greater autonomy. It no longer just describes what has happened: it enables action and strengthens agility.
A Customer Data Platform (CDP) is an excellent complement to BI. It's a powerful combo for managing and personalising the customer experience.
Composable CDP and BI: Complementary components of a modern data stack
Business Intelligence helps analyse past performance, guide activity, and support strategic choices. A Customer Data Platform (CDP) enables action by activating customer data from multiple sources (CRM, website, transactions, support, etc.).
As part of a Modern Data Stack, a composable CDP strengthens this synergy. Like BI tools, it works directly from the data warehouse without duplicating data into its own database.
As a result, marketing and sales teams have access to reliable, up-to-date data organised around a single customer view (SCV). The data warehouse serves as the source of truth for launching targeted campaigns and delivering a personalised experience.
💡 With its no-code features, the DinMo composable CDP enables business teams to activate customer data autonomously. It is the perfect complement to Business Intelligence.
For example, a company can segment its audiences in the CDP based on behaviour or customer value. These segments are then analysed in a BI dashboard to assess campaign ROI. The data flows continuously in both directions.
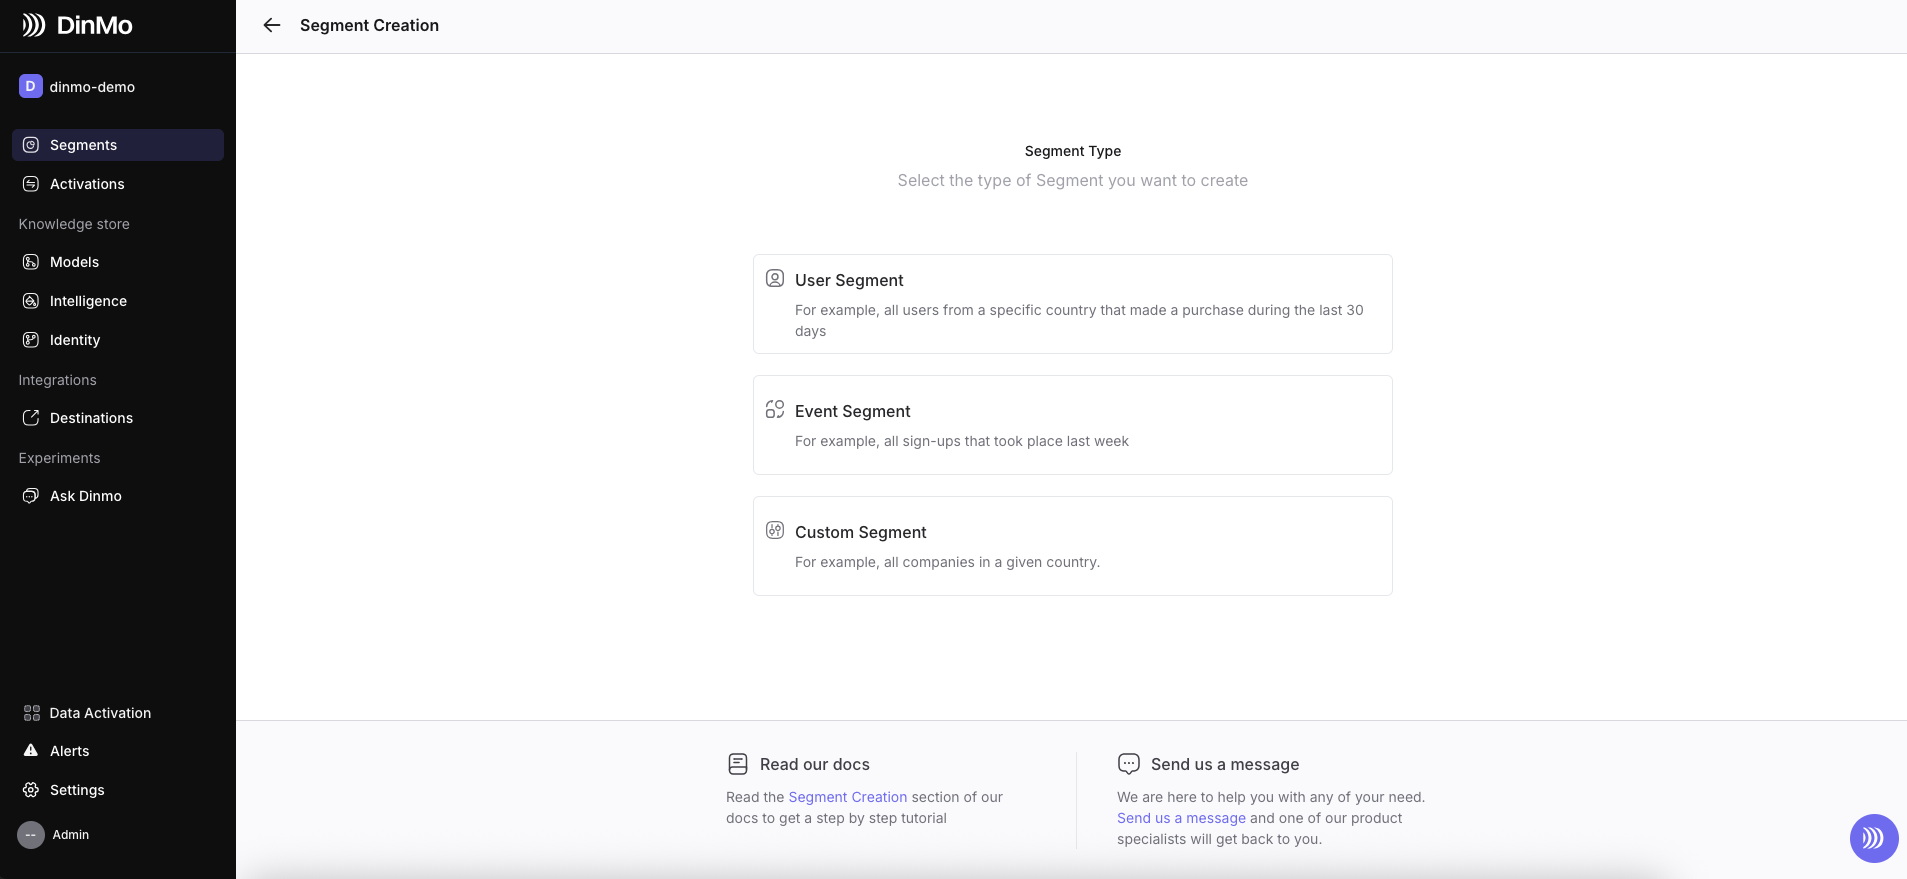
Create an audience segment on DinMo
This natural association between BI and composable CDP empowers teams to react quickly, based on reliable, actionable insights.
💡 With DinMo Customer Hub, business teams explore audiences and track their KPIs in an interface designed for marketing. By providing a unified customer view, this new module makes it easier to move from analysis to action.
Benefits in a data-driven environment
In the era of big data, Business Intelligence increases operational efficiency. It enables faster, fact-based decision-making rather than relying on gut feeling.
Key indicators are available in real time via shared dashboards, reducing silos and boosting team agility. Everyone relies on the same data sources and aligns their actions with shared goals.
Modern BI tools are increasingly accessible. Thanks to intuitive interfaces and no-code functions (drag-and-drop, filters, visualisations), anyone can analyse data and create reports without technical expertise.
Conclusion
Business Intelligence is a vital tool for steering business performance. It transforms raw data into concrete insights that can be shared across teams.
A composable Customer Data Platform maximises its impact. Data is no longer just for analysing past performance, but also for launching targeted, consistent, measurable actions.
Adopting a data-driven approach means shifting the culture and using accessible tools. The synergy between BI and CDP provides a solid foundation to make better decisions and activate your data more effectively.
FAQ
What is the connection between Business Intelligence and Big Data?
What is the connection between Business Intelligence and Big Data?
Business Intelligence (BI) aims to turn data into actionable insights to support decision-making. Initially, it relied on structured data from systems such as ERPs or CRMs.
Big Data introduces massive volumes, often unstructured (logs, social media, IoT, etc.), characterised by volume, velocity, and variety.
Modern BI tools have evolved to handle these new sources through data lakes, APIs, or cloud warehouses. BI thus makes massive data accessible and usable across the business through dashboards and shared reports.
What are the roles associated with Business Intelligence?
What are the roles associated with Business Intelligence?
Several roles contribute to the implementation of BI: data analysts design reports, data engineers ensure data integration and quality, and business analysts translate operational needs into key metrics.
Roles such as product managers and marketers also use BI tools to guide their actions based on reliable and shared data.
How can BI insights be connected to marketing campaigns?
How can BI insights be connected to marketing campaigns?
A Customer Data Platform (CDP) makes it possible to harness the insights generated by BI. Dashboards and reports help identify the most profitable segments or pinpoint friction points.
This data is then used to personalise campaigns through activation tools (email, ads, CRM, etc.). In a composable CDP, this is achieved through native connectors or Reverse ETL functions.
How long does it take to deploy a Business Intelligence solution?
How long does it take to deploy a Business Intelligence solution?
It all depends on the complexity of the data and the tools selected. With a cloud-based architecture and modern BI solutions such as Power BI or Looker, an initial version can often be deployed within a few weeks or even just a few days.
The longest phase is usually the data preparation and the definition of objectives. Once connected to the data warehouse, the BI solution quickly becomes operational, enabling the creation of dashboards and the monitoring of key performance indicators.


