Understanding and leveraging the Net Promoter Score (NPS)
7min • Last updated on Oct 13, 2025

Olivier Renard
Content & SEO Manager
Tesla is a brand that never fails to elicit strong opinions. In 2023, the car manufacturer boasted a customer satisfaction and loyalty rate that left its competitors envious.
Today, the controversies surrounding Elon Musk’s public stances have affected the brand’s image. A sharp reversal that serves as a reminder that a company’s reputation can change rapidly.
For brands, the Net Promoter Score (NPS) remains a key indicator to measure customer satisfaction, detect early warning signs, and anticipate risks of churn or reputational damage.
Key Takeaways:
The Net Promoter Score measures the likelihood that customers will recommend a brand or product to friends and family
This metric provides a concise overview of customer satisfaction and loyalty, based on a single question. It serves as a benchmark to be interpreted according to context and industry sector.
A high score indicates a loyal customer base. It helps identify brand advocates who are likely to actively promote the brand, as well as emerging concerns.
By segmenting consumers into three categories, the NPS helps guide marketing campaigns and loyalty-building efforts within a data-driven approach.
🔍 Learn how the NPS works and how to calculate it easily. Discover how to use it to enhance customer loyalty and guide your marketing actions. 🚀
What is the Net Promoter Score (NPS)?
The Net Promoter Score, or NPS, is an indicator that measures customer loyalty and their likelihood of recommending a brand.
It is based on a single question asked after a purchase or interaction:
« On a scale of 0 to 10, how likely are you to recommend [company / brand / product / service name] to a friend or colleague?»
The score was created in 2003 by Fred Reichheld, in collaboration with Bain & Company and Satmetrix. Its objective: to offer a simple, actionable, and universal metric for long-term customer satisfaction.

Customer satisfaction
Why is this indicator so popular?
NPS has become a standard in marketing and customer experience for several reasons:
It is easy to implement and monitor over time.
It enables comparison across services, products, or touchpoints.
It refocuses the company on its core mission by putting the customer experience at the heart of its priorities, through a customer-centric approach.
It is strongly correlated with growth: studies published in Harvard Business Review have shown that a high NPS is often linked to sustainable commercial performance.
This is why many companies have been using it for over 20 years. Giants like Apple, Amazon, Tesla, Airbnb, Starbucks, and Netflix frequently display very high NPS scores.
💡 NPS doesn’t measure a one-off satisfaction. It captures an overall sentiment: trust, emotional connection to the brand, and genuine intent to recommend.
A good score reflects a strong customer relationship, based on perceived quality and lived experience.
How to calculate and interpret the NPS?
Calculation method
The NPS is quick and easy to calculate. As mentioned, it uses a 0 to 10 scale (10 being the highest). Customers respond to a survey with a single question: “Would you recommend our company to a friend?”
Responses are categorised into three groups:
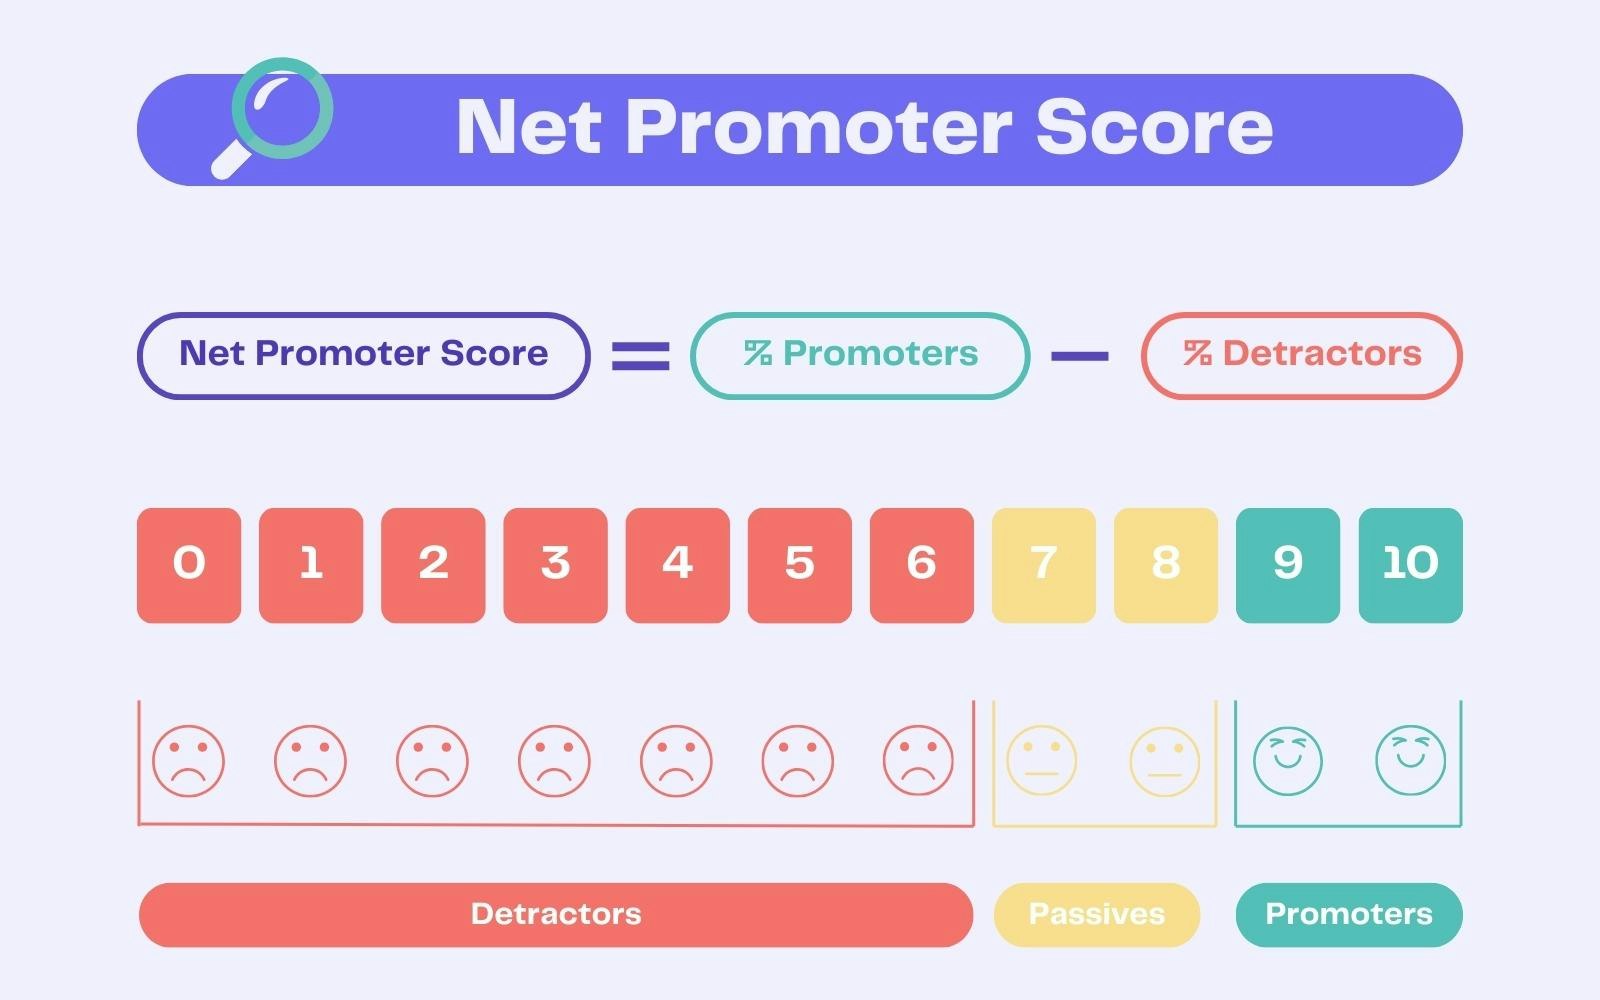
“Promoters” (score 9 or 10): highly satisfied customers likely to actively recommend the brand.
“Passives” (score 7 or 8): generally satisfied but not particularly engaged.
“Detractors” (score 0 to 6): dissatisfied customers, at risk of churn or negative word-of-mouth.
NPS formula:
% of Promoters – % of Detractors
💡 Example :
Out of 100 respondents:
50 are Promoters
20 are Passives
30 are Detractors
The percentage of passives is not included in the NPS calculation.
👉 The Net Promoter Score is 50 - 30 = +20

Net Promoter Score (NPS) calculation
Score interpretation
The NPS ranges from –100 (all detractors) to +100 (all promoters). The higher the score, the more likely the brand is to have loyal ambassadors.
While comparisons across industries are difficult, here are some benchmarks:
A positive score is already a good sign.
A score of +50 or more is generally considered excellent.
A score around 0 indicates a fragile balance between satisfied and dissatisfied customers.
💡 A good NPS for a luxury brand may not be the same as for an online service platform. You must contextualise the score based on your specific industry standards.
NPS is a broad indicator and should be used as a guide, monitored over time, and compared with other data (qualitative feedback, repurchase rate, churn rate, etc.).
What is the purpose of this indicator?
A signal of loyalty and word-of-mouth
NPS is not limited to satisfaction surveys. It captures emotional attachment to the brand and the willingness to recommend:
A high score indicates a loyal, engaged customer base, ready to act as ambassadors.
A low score suggests disappointment or loss of trust.
It’s an excellent predictor of word-of-mouth, especially in an age where peer reviews and opinions matter more than adverts.
A tool for monitoring and strategic decision-making
NPS helps track the evolution of customer relationships over time. It identifies friction points and informs corrective actions.
It acts as a strategic compass to improve the overall experience: interface, journey, service, after-sales, personalisation.
It’s useful to put the score in context. Many companies correlate their NPS with key events (new offer, product launch, website redesign) to measure the real impact on customer perception.
A lever for marketing activation
Beyond measurement and journey analysis, NPS is a valuable insight for launching marketing actions across all three segments:
Promoters can be engaged for referral campaigns, testimonials, or user-generated content (UGC).
Detractors can be identified and addressed proactively: listening, goodwill gestures, exclusion lists, dedicated paths.
Passives can be targeted with personalised offers to boost engagement and convert them into Promoters.
💡 NPS becomes even more powerful when combined with other KPIs and your first-party customer data. This enriched view enables more effective segmentation, activation, and personalisation of marketing actions.

How DinMo helps Galeries Lafayette make the most of its customer data
How to improve your NPS?
1️⃣ Listen to qualitative feedback
NPS alone isn't enough. The verbatim responses give meaning to the score. They highlight pain points, key moments, and improvement opportunities.
By categorising customer comments, you can identify recurring trends: delivery issues, poor responsiveness, unintuitive interface, etc.
The most effective brands implement feedback loops to resolve issues quickly and inform the relevant teams (support, product, marketing).
2️⃣ Create personalised journeys
The goal: turn scores into action to enhance the customer journey and overall experience.
Rely on the feedback collected: simplify a purchase funnel, adjust a message, streamline customer support.
Set up automated responses based on identified signals to increase responsiveness without overburdening teams.
Activate re-engagement or loyalty levers such as targeted offers, personalised benefits, or ambassador programmes.
3️⃣ Integrate NPS into a data-driven strategy
NPS can be cross-referenced with other KPIs when integrated into your business tools: retention rate, LTV, Customer Effort Score (CES), or Customer Satisfaction Score (CSAT).
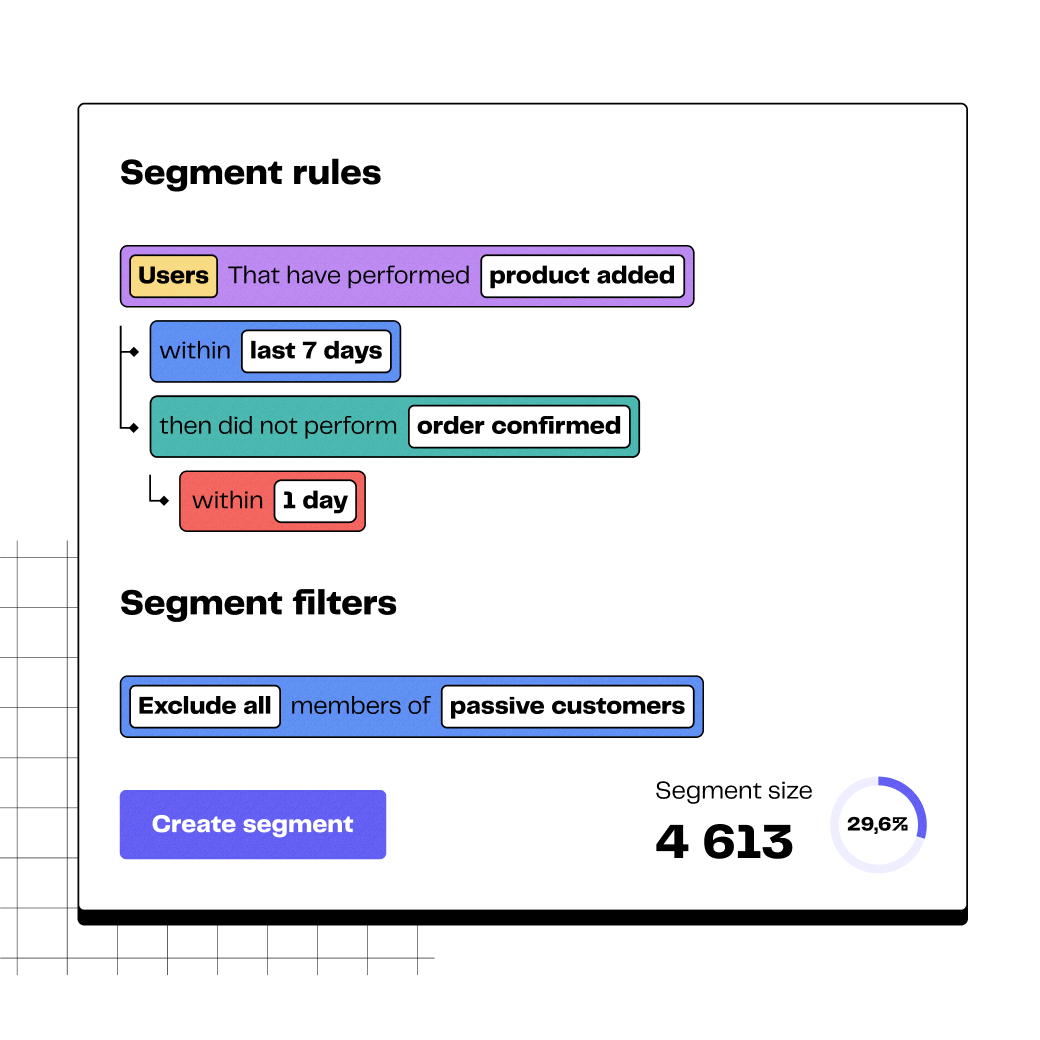
💡 DinMo’s Customer Data Platform (CDP) lets you create a segment of Promoters with high LTV, based on your customer data. This segment can then be synchronised with ad platforms or CRM for highly targeted ambassador campaigns.

Many rules can be imagined to create segments
Best practices and common mistakes
What to do
The NPS becomes a strategic tool when it is properly integrated into your processes.
Automate NPS surveys at key points in the customer journey: order, delivery, support interaction.
Analyse results at multiple levels: overall, by segment, by product, or by channel. This helps to identify what works well and what doesn't.
Share insights internally. NPS involves all teams: marketing, support, product, leadership, aligning their actions around the customer voice.
What to avoid
Various biases can distort the results or limit the impact of the NPS:
Asking the question too early, before the customer has had a genuine experience with your company.
Ignoring the simplicity principle by offering a long and complex survey, contrary to the NPS spirit.
Relying solely on NPS to guide satisfaction or overall business strategy. It remains one metric among others (CSAT, CES, churn rate…).
Overlooking neutral or passive feedback, which can offer valuable insights – revealing friction points or disengagement.
💡 A 2021 Gartner report highlighted the limits of traditional NPS as a measure of service quality. The Net Promoter 3.0 framework proposes an enriched, customer-focused view aligned with business reality.
Conclusion
The Net Promoter Score remains one of the best indicators to assess brand loyalty and perception. When properly interpreted, it helps detect weak signals, uncover opportunities, and continuously refine the customer experience.
Cross-referenced with first-party data, it becomes more than a score: it’s a lever to personalise marketing actions and boost engagement.
Integrated into a data-driven approach, NPS is a valuable insight to trigger activations at the right time, on the right channel. It enhances journeys and improves customer experience.
📊 DinMo helps companies fully leverage their data with precision, agility, and without technical complexity. Contact us for a free trial of our solutions.
FAQ
What is the difference between NPS, CSAT and CES?
What is the difference between NPS, CSAT and CES?
The NPS (Net Promoter Score) measures long-term loyalty by assessing how likely a customer is to recommend the brand.
CSAT (Customer Satisfaction Score) evaluates immediate satisfaction after an interaction.
CES (Customer Effort Score) measures how much effort is required to resolve an issue or receive a service.
👉 These three indicators are complementary: NPS offers a broad overview, while CSAT and CES help optimise specific points in the customer journey.
Is NPS suitable for B2B?
Is NPS suitable for B2B?
Yes, NPS is perfectly applicable in a B2B context. It helps measure the loyalty of business clients and identify brand advocates.
In this setting, it is often useful to combine responses with other customer data, such as account size, usage frequency or interactions with teams.
NPS then becomes a valuable tool for strengthening commercial relationships and better targeting loyalty initiatives.
How often should NPS be measured, and which tools should be used?
How often should NPS be measured, and which tools should be used?
This depends on your business. Some companies measure NPS continuously, following key moments (purchase, support, renewal), while others conduct monthly, quarterly or annual surveys.
The key is to be consistent in order to track changes over time.
As for tools, many platforms allow for automated tracking: survey tools (Typeform, SurveyMonkey), CRMs (HubSpot, Salesforce), or specialist platforms like Hotjar or Qualtrics.


