Using cluster analysis for customer segmentation
7min • Last updated on Mar 3, 2026


Olivier Renard
Content & SEO Manager
[👉 Summarise this article using ChatGPT, Google AI or Perplexity.]
We are expected to generate 394 zettabytes of data globally by 2028, a 117% increase compared to 2025 (Statista). Yet estimates suggest that less than 10% of this data is actually analysed by companies to extract actionable insights.
This vast pool of information offers a unique opportunity to refine customer knowledge and personalise marketing efforts. To make the most of it, brands must adopt a rigorous analytical method.
Key Takeaways:
Cluster analysis involves grouping data or individuals with similar characteristics to uncover behaviours, needs or typical profiles.
It relies on statistical algorithms — such as K-means or hierarchical clustering — capable of automatically detecting these groups within large datasets.
Used across many sectors (healthcare, education, finance), it enables marketing teams to segment customer databases and identify new opportunities.
Combined with a Customer Data Platform (CDP), cluster analysis provides valuable insights that enhance targeting and support decision-making.
🔍 What is cluster analysis and how does it help businesses better understand their audiences? Discover how clustering methods are redefining customer segmentation. 🎯
What is cluster analysis?
Cluster analysis (also known as clustering) is a statistical method that groups similar data into homogeneous categories called clusters.
It aims to identify hidden structures in a dataset without knowing in advance what those groups are.
Unlike traditional segmentation, which is based on pre-defined criteria (age, location, average basket value, etc.), cluster analysis relies on algorithms that explore relationships between data points. They measure intra- and inter-cluster distances to determine which data points are most alike.
Technically, it is an unsupervised learning method: it does not aim to predict an outcome but to explore datasets to reveal their structure. It naturally identifies similarities and creates consistent groups that are often invisible to traditional methods.
Cluster analysis is applied in many fields, such as:
Public health, to track the spread of an epidemic or identify patient profiles;
Education, to detect trends and adapt the training offer;
Finance, to understand investor profiles or detect unusual behaviour;
Marketing, to refine customer segmentation and better understand audiences.
💡 For example, an e-commerce site can group its customers based on purchasing behaviour rather than age or location. This approach helps identify high-potential segments and tailor marketing actions accordingly.
In healthcare, the term cluster immediately brings to mind the Covid-19 pandemic, where this logic was used to detect infection clusters by grouping cases based on location or symptoms.
")
Main Covid-19 hotspots in 2023 (credit: Articque)
Why is cluster analysis important in marketing?
In an omnichannel environment, customer interactions are numerous — on websites, mobile apps, social media, and in-store.
These exchanges generate a high volume of data that must be analysed in real-time to deliver a personalised experience. Among the available segmentation methods, traditional techniques often reach their limits.
Cluster analysis reveals segments that demographic criteria wouldn’t otherwise identify. These segments reflect preferences, purchase patterns, or even estimated customer lifetime value (CLV).
This method allows brands to better understand their audiences and fine-tune their campaigns. With the support of artificial intelligence, it also enhances cross-channel coherence and improves return on investment.
The main clustering methods
The main families of clustering algorithms
Each method groups similar data to uncover hidden structures. The difference lies in how similarity is measured and how the groups are formed.
1️⃣ Centroid-based clustering (K-means and variants)
This model clusters data points around centres called centroids. The K-means algorithm calculates each cluster's centre and adjusts groups until internal distances are minimised.
Variants include: K-means++, K-medoids, Mini-Batch K-means.
2️⃣ Hierarchical clustering
This builds a nested group classification, similar to a taxonomy. The result is visualised as a tree (or dendrogram) illustrating proximity between elements.
3️⃣ Density-based clustering
The algorithm looks for areas where data points are dense and close together. More isolated zones are considered anomalies.
The most well-known model is DBSCAN (Density-Based Spatial Clustering of Applications with Noise).
4️⃣ Distribution-based clustering
This assumes that the data comes from several statistical distributions. Algorithms like Gaussian Mixture Models (GMM) estimate the probability that a point belongs to a given cluster.

4 basic types of cluster analysis
💡 Other methods also exist, such as fuzzy clustering (partial membership in several groups) or spectral clustering, often used in more technical contexts like image recognition or very large data volumes.
How to choose the right clustering method?
The choice depends on data type, desired number of groups, and interpretability level.
Method | Main advantage | Limitation | Typical marketing use |
|---|---|---|---|
K-means (centroid-based) | Fast and easy to interpret | Requires number of clusters to be pre-set | Create homogeneous customer segments based on purchase behaviour |
Hierarchical clustering | Intuitive visualisation (dendrogram) | Less suited to very large datasets | Identify relationships between customer sub-segments |
DBSCAN (density-based) | Handles noise and irregular shapes well | Sensitive to parameter tuning | Detect unusual behaviours or niche segments |
GMM (distribution-based) | Flexible and realistic segments | More complex to interpret | Model evolving or mixed behaviours |
Advantages, limitations and marketing use cases of different clustering methods
There’s no one-size-fits-all approach. Some models favour simplicity, others precision or flexibility.
In marketing, the goal remains to turn clusters into actionable insights: better audience targeting, message personalisation, and campaign performance improvement.
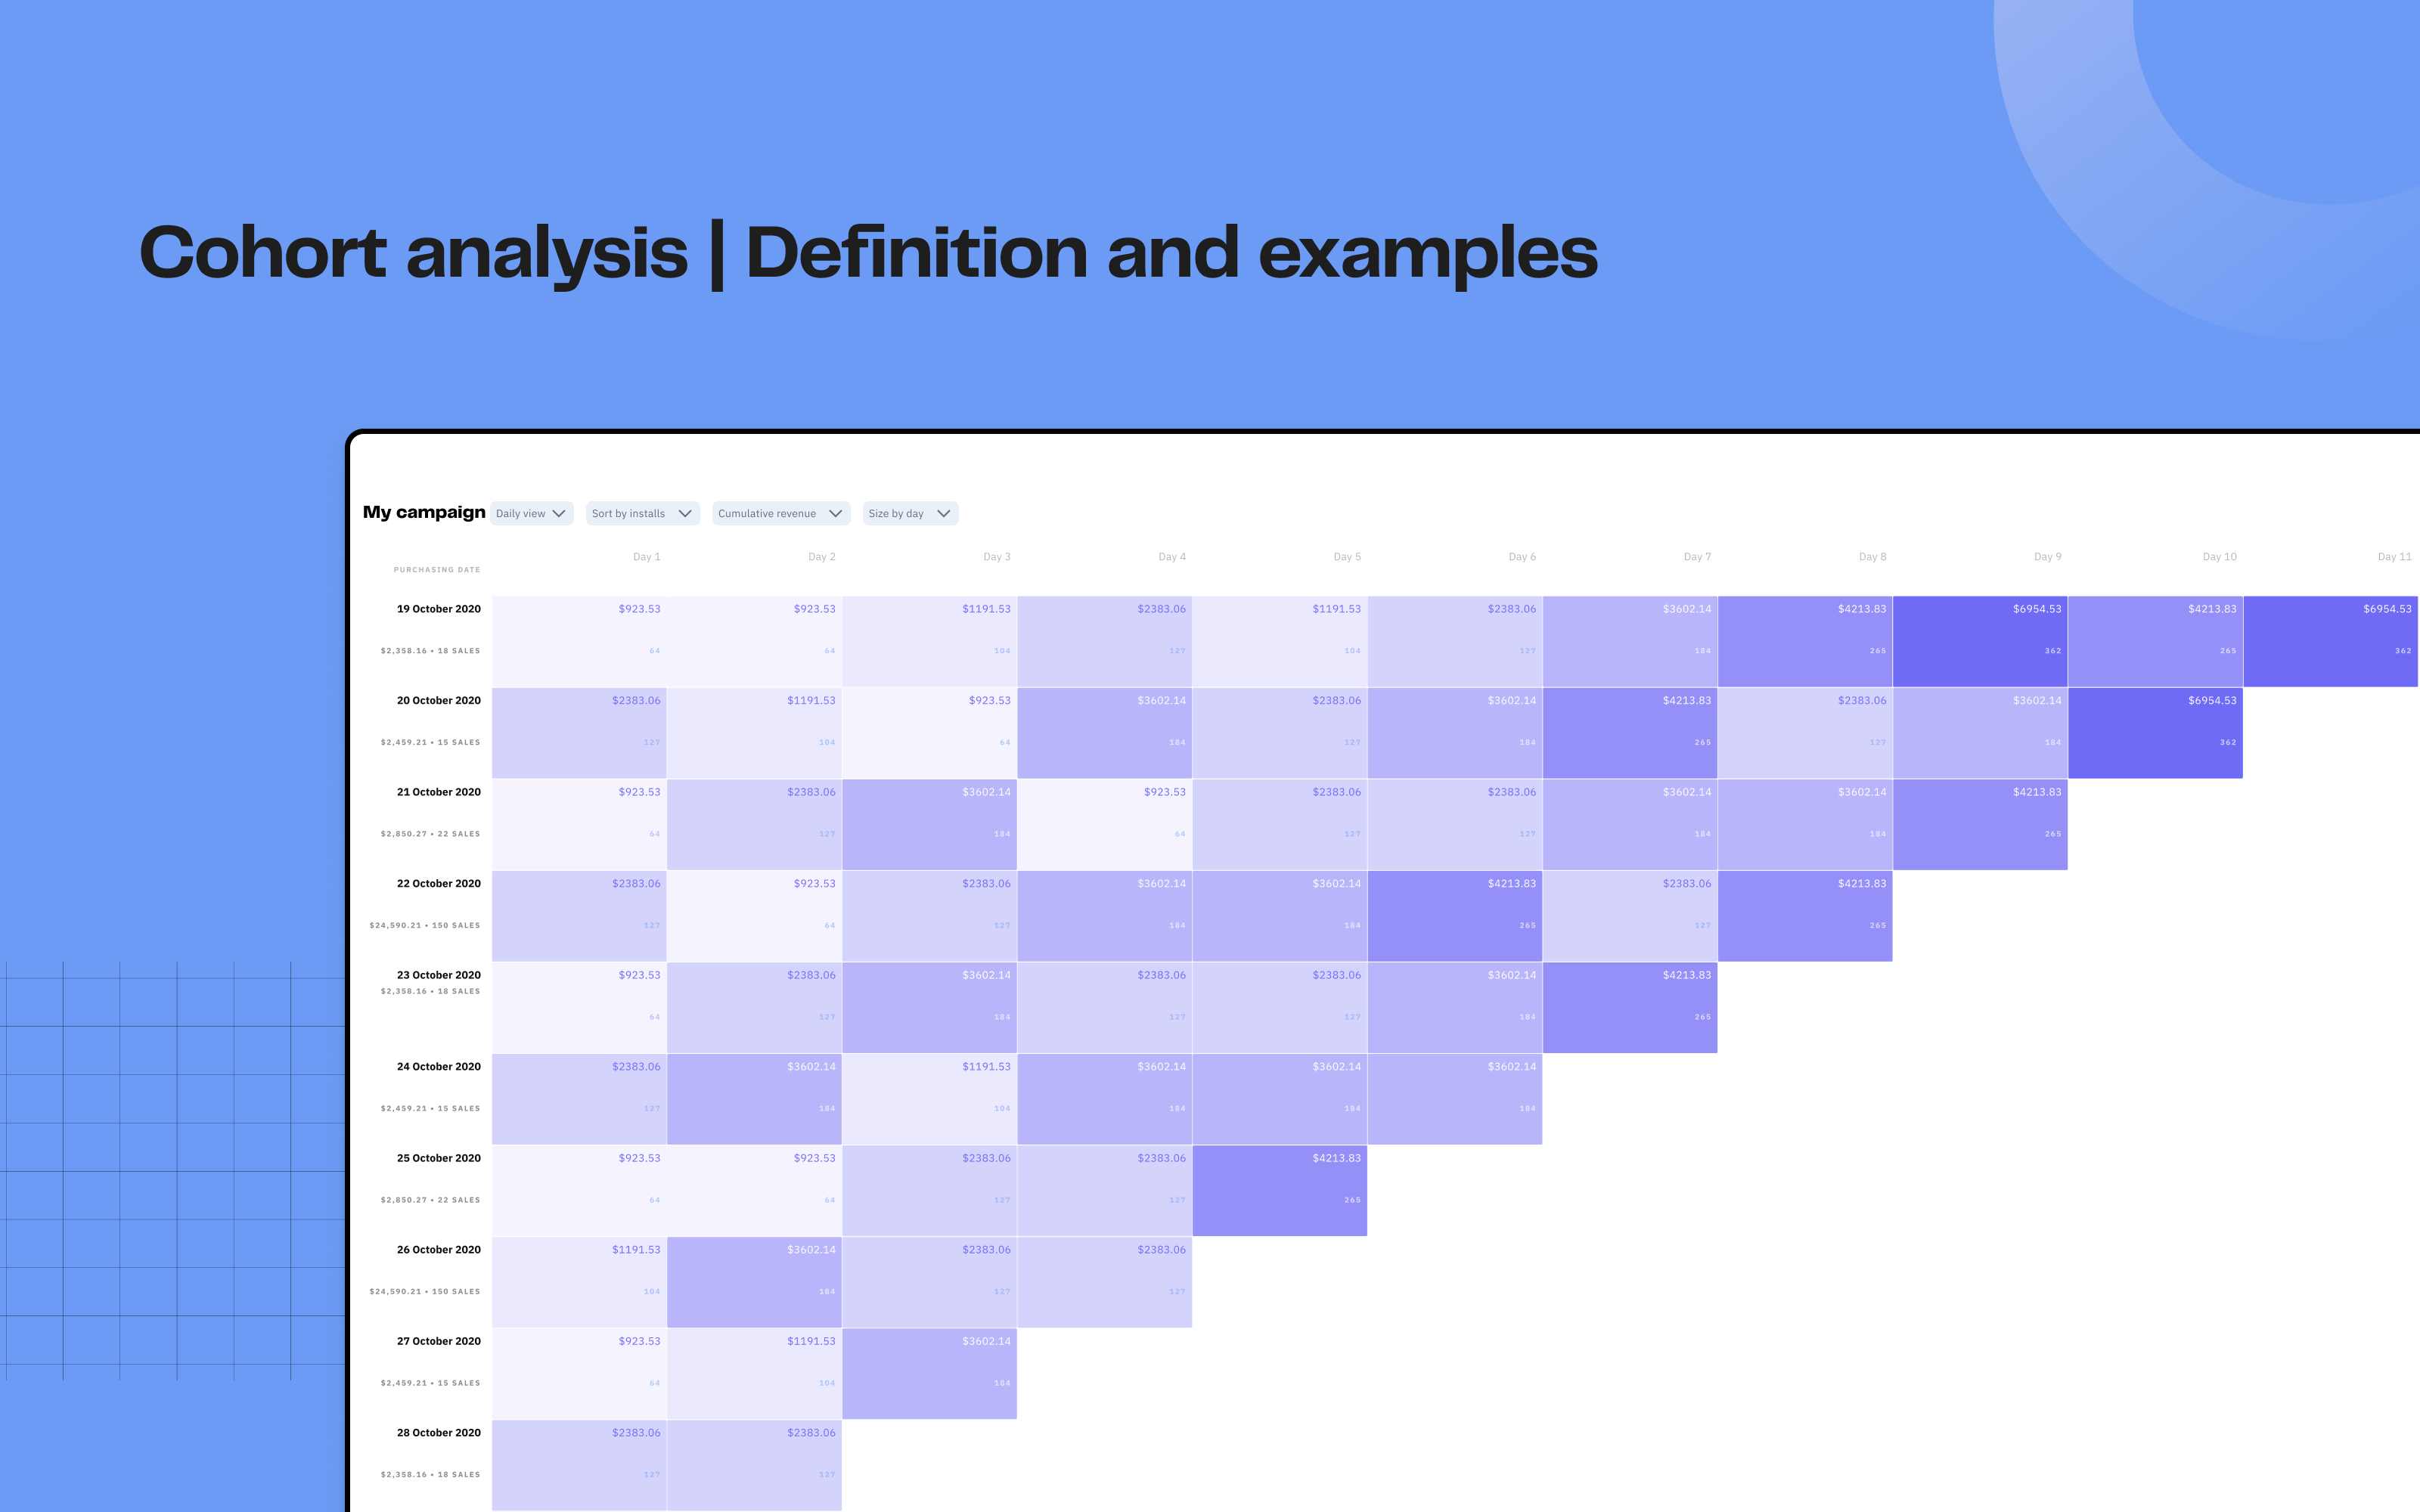
.")
Cluster analysis is widely used in Business Intelligence (BI).
Real-world marketing applications of clustering
Cluster analysis helps brands make better use of their customer data. It provides a foundation for understanding behaviours, refining targeting, and optimising campaigns.
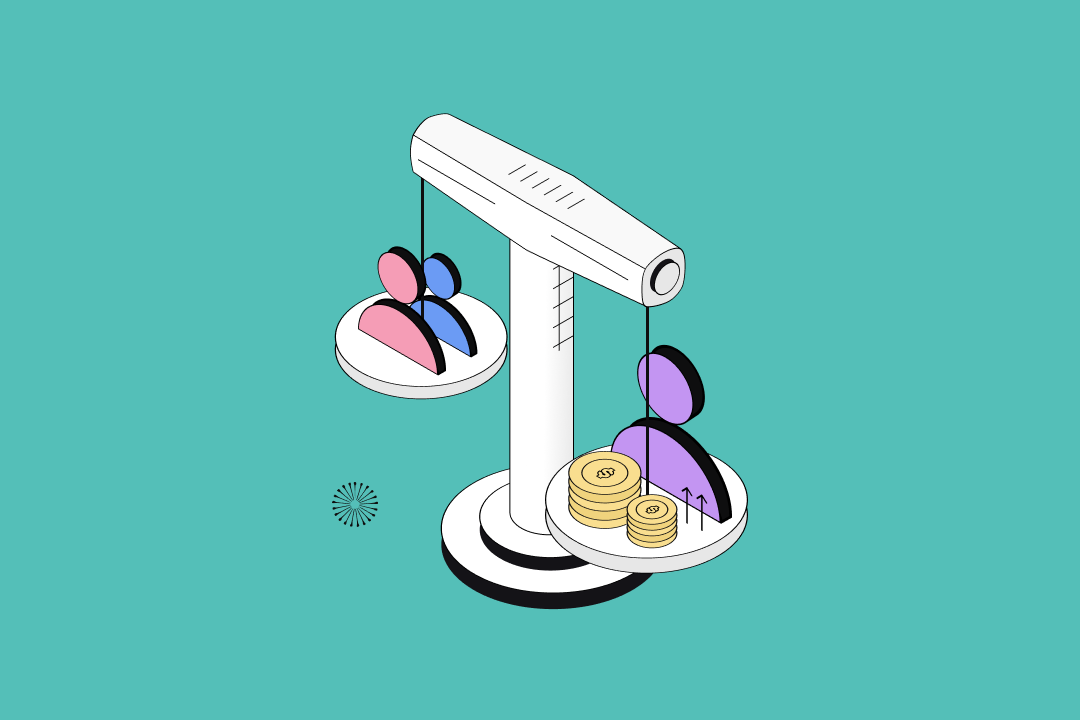
Advanced customer segmentation
Segmentation is the most natural application of clustering. Rather than static criteria (age, location), clustering groups customers by patterns identified by machine learning algorithms.
Brands can identify homogeneous groups, such as:
High-value “premium” clients,
Occasional buyers who respond to promotions,
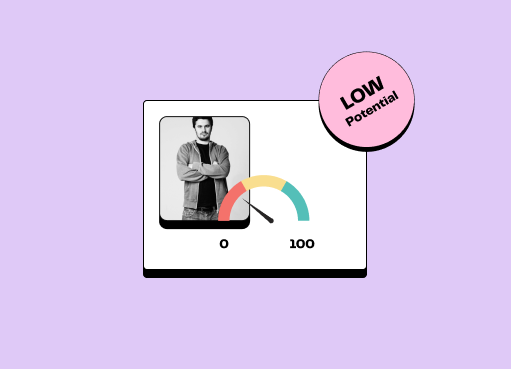
At-risk churn profiles.
💡 Example: A SaaS company runs cluster analysis on its data. The algorithm identifies several groups: high-potential clients, regular users with declining engagement, and churn-risk profiles. These insights help refine offers and prioritise re-engagement or loyalty campaigns.
This method complements customer scoring techniques, such as RFM segmentation or ABC cross matrices, by revealing new customer groups with shared behaviours.
Campaign optimisation and recommendations
Clustering enables personalised journeys. Each segment can receive tailored messages or offers on the most appropriate channel.
This approach increases campaign relevance and enhances the omnichannel customer experience. A Customer Data Platform (CDP) plays a key role by connecting segments to activation tools (email, SMS, social media, apps, or websites).
💡 A CDP can display product recommendations based on the behaviour of similar users, or adjust CRM scenarios in real-time based on cluster changes.
Other business use cases
Beyond marketing, clustering applies to many strategic areas. It helps determine which product ranges attract similar customer types or identify market expansion opportunities.
In finance or e-commerce, clustering is also used for fraud detection, grouping suspicious transactions into clusters that reveal abnormal patterns.
Thanks to advanced analysis, companies gain reactivity and precision. They can anticipate trends, adjust strategy, and maximise return on investment.
From clustering to activation: the role of a composable CDP
Unifying data for actionable insights
For cluster analysis to deliver relevant results, data must be reliable, up-to-date, and centralised. We recommend using your cloud data warehouse as the single source of truth.
Our composable CDP works directly on your warehouse data, without duplication, to create a 360° customer view. This ensures coherence and compliance while avoiding the technical burden of an integrated infrastructure.
Activating segments without technical dependence
Once clusters are identified, it's time to activate them. Thanks to its no-code interface, DinMo lets you connect these segments to marketing tools in just a few clicks — no technical team required.
💡 Example: A “high-value premium clients” segment can be automatically synced with HubSpot, Klaviyo, Meta Ads, or Google Ads. Our CDP then defines the Next Best Action to provide the optimal customer experience.
Marketing teams can then launch personalised multichannel campaigns, in sync with warehouse data.


Data Activation
Challenges and best practices
Data quality is a key challenge in clustering. A thorough data preparation phase helps avoid artificial groups or misinterpretations.
You also need to balance analytical rigour with business relevance. The goal is not to use the most complex models but to efficiently segment for marketing teams.
Finally, only what gets measured can be improved. Tracking campaign performance helps adjust clusters and refine segments over time.
Conclusion
Cluster analysis paves the way to deeper customer behaviour understanding. By grouping data based on similarities, it reveals natural segments often missed by traditional approaches.
At DinMo, our mission is to make data accessible to all. Our composable CDP offers a no-code, intuitive interface that benefits both marketing and data teams.
By basing decisions on reliable insights, teams can improve targeting, adapt journeys, and increase overall marketing performance.
🎯 Discover how DinMo turns cluster analysis into measurable marketing actions.
FAQ
What is the difference between cluster analysis and marketing segmentation?
What is the difference between cluster analysis and marketing segmentation?
In its traditional form, marketing segmentation relies on predefined criteria such as age, income, or industry.
Cluster analysis, on the other hand, automatically identifies homogeneous groups based on real data, uncovering behaviours or profiles that are often invisible to conventional approaches.
How to perform a cluster analysis step by step?
How to perform a cluster analysis step by step?
It involves four main stages:
- Data preparation (pre-processing),
- Selection of the most relevant input variables,
- Choice of algorithm (K-means, hierarchical, etc.) to explore the relationships between these variables,
- Interpretation of the resulting clusters to extract actionable insights.
How to interpret the results of a cluster analysis?
How to interpret the results of a cluster analysis?
Each cluster represents a group of elements (individuals, products, companies, etc.) that share similar attributes.
In marketing, the goal is to identify their common characteristics to understand their expectations, personalise offers, and tailor actions accordingly.
Which tools should you use to perform a cluster analysis?
Which tools should you use to perform a cluster analysis?
Data scientists often rely on Python, R, or BigQuery ML. For simpler analyses, Excel or SPSS are sufficient.
A Customer Data Platform (CDP) leverages clustering results to activate segments across marketing channels — without requiring technical skills.